Gengming Li
A Visual Communication Design Study: Graphic Element Design Under Traditional Handwork
Abstract: The addition of traditional elements can enhance the uniqueness of visual communication design. This paper briefly introduced visual communication and applications of traditional elements in visual communication design and applied paper cuts, a handmade graphic element, to the logo design of Dezhou University's 50th anniversary. The convolutional neural network (CNN) algorithm and the analytic hierarchy process method were applied to evaluation analysis and compared with the support vector machine (SVM) algorithm. The results of the CNN algorithm on the test set verified its effectiveness. The evaluation results of the CNN algorithm were similar to the manual evaluation results, further proving the effectiveness and high efficiency of the CNN algorithm. The hierarchical analysis and the analysis of the assessment results of the CNN algorithm found that the two logo designs made full use of paper cuts.
Keywords: Convolutional Neural Network , Graphic Elements , Traditional Handwork , Visual Communication
1. Introduction
Product packaging, magazine covers, and advertising posters are all graphic designs that we can come into contact within our daily lives [1]. The visual impression of the above things is the outcome of elaborate design and display, whose final purpose is to draw the attention of the masses and to express the designer’s meaning implied in graphic designs [2]. Graphic design is the combination of text and images in a two-dimensional flat space following some rules, i.e., typography, and then shows the combination results via printing and other methods. As technology and related theories in the field of design develop, more and more elements can be utilized in graphic design. Graphic design focuses on the visual expression of the content, so visual elements are the key to design. Excellent design of visual elements can attract the audience’s attention to the greatest extent [3], and excellent design must have its uniqueness. China’s traditional culture has been handed down for a long time and has a considerable number of unique visual elements, which provides a fresh development direction for graphic design and facilitates the production of graphic design works with distinctive national features. Velasco et al. [4] put forward an experimental approach that could evaluate the response of consumers to the orientation changes of various design elements such as food images on product packaging. The experimental results presented the complex relationship that exists between preferences and willingness to pay and proposed some questions regarding the effect of orientation on visual aesthetics, perceived value, and preferences. Yuan et al. [5] put forward a method based on Kansei engineering (KE) and interactive genetic algorithm (IGA). The results of the case study suggested that the method obtained desirable color schemes. This paper briefly introduced visual communication and applications of traditional elements in visual communication design. Paper cut, a handmade graphic element, was applied to the logo design for the 50th anniversary of Dezhou University. The designs were evaluated and analyzed with the analytic hierarchy process method and the convolutional neural network (CNN) algorithm. This paper aims to assess the visual communication effect of graphic designs with an intelligent algorithm instead of labor, thus facilitating graphic designs.
2. Visual Communication
Visual communication design achieves the purpose of communicating something specific in the form of visualization. In visual communication design, two-dimensional images such as logos, paintings, and colors are the main focus, and the design process needs to follow some principles to ensure that the design products are applicable, cultural, and artistic [6]. The visual elements in visual communication design can be generally classified into composition patterns, colors, and texts. The composition pattern reflects the style of graphic design. The design of composition patterns will express the specific product content with abstract means, and the application of computer technology can make the design more efficient [7]. Color matching highlights the spirit reflected by the graphic design. Reasonable color matching can draw the audience’s attention at first glance. Text description directly reveals the essence of the graphic design. The text itself can also play a decorative role. As a kind of pictographic character, Chinese characters are transformed from graphics. Chinese characters in different forms of calligraphy can play a better decorative role [8].
The application of visual elements in graphic visual communication design is intimately related to market competition, and the distinctiveness of visual element design can help distinguish one product from another and play the role of self-advertisement. Traditional culture with a time-honored history offers a novel direction for the choice of visual elements in graphic design, bringing a special national character to graphic design [9].
Traditional elements are visual elements derived from traditional culture, which contain distinctive features of Chinese culture. Traditional visual elements with concrete images include seals, paper cuts, Chinese painting, face painting, and pottery [10]. The design to be analyzed in this paper references paper cuts. Paper cuts are a traditional handicraft in China, which uses scissors or carving knives to cut paper to make the paper have a regular hollow structure. The cut papers are pasted on the wall or window, becoming a beautiful decoration. Paper cuts can be divided into Yin cuts and Yang cuts according to different hallow parts. Yin cuts hollows out the main body, i.e., the hallow parts are used as the lines of the internal picture. Yang cuts are the opposite of Yin cuts.
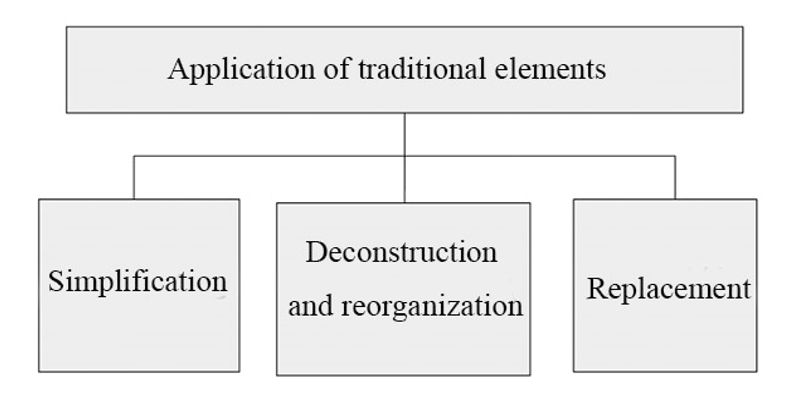
The way of applying traditional elements in visual communication design is shown in Fig. 1, including the simplification, deconstruction and reorganization, and replacement of traditional elements. Among them, the simplification of traditional elements is very common in graphic design, which can be compatible with other elements better [11].
The deconstruction and reorganization of traditional elements means rearranging and combining different traditional elements to create novel visual elements to achieve the effect of preserving the traditional cultural context while giving the audience a new visual impact.
The replacement of traditional elements is to replace the original visual elements with others in nature in accordance with some connection in the structure of the graphic design, so as to achieve a refreshing effect [12].
3. Example Analysis
3.1 Analysis Object
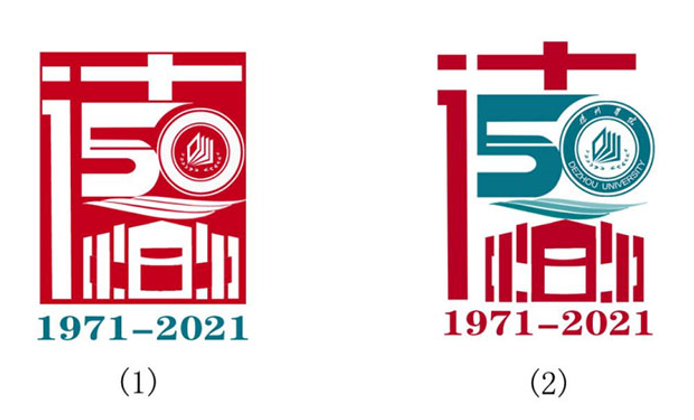
Paper cuts are a traditional handicraft in China, a folk art that uses scissors or carving knives to cut papers for decoration life or cooperation with other folk activities. The broad mass base of paper cut makes it an important part of various folk activities. It has multiple social values such as cognition, edification, expression, lyricism, entertainment, and communication. Paper cuts were enlisted into the first batch of National Intangible Cultural Heritage in May 2006 [13] and listed in the Representative List of Intangible Cultural Heritage of Humanity in October 2009. This paper used the graphic elements within paper cuts to design the logo for the 50th anniversary of Dezhou University. Fig. 2 shows two design proposals.
3.2 Analysis Methods
The main purpose of graphic visual design is to draw the viewer’s attention. Different people have different levels of attention, so the assessment of designs becomes relatively subjective. When faced with massive designs, it is inefficient to rely on a single person to evaluate them, but if multiple people evaluate them, the subjective individual feelings make it difficult to unify the evaluation criteria and reduce the credibility of the evaluation. Intelligent algorithms can efficiently evaluate graphic designs through parallel processing; moreover, an intelligent algorithm has only one set of evaluation criteria [14], so it can avoid the different criteria caused by multiple evaluation perspectives.
This paper selected the CNN algorithm, which is more suitable for image recognition, to evaluate the visual design. Before evaluating the graphic design with the CNN algorithm, we need to train the algorithm to obtain suitable algorithm parameters. The basic flow of algorithm training is shown in Fig. 3.
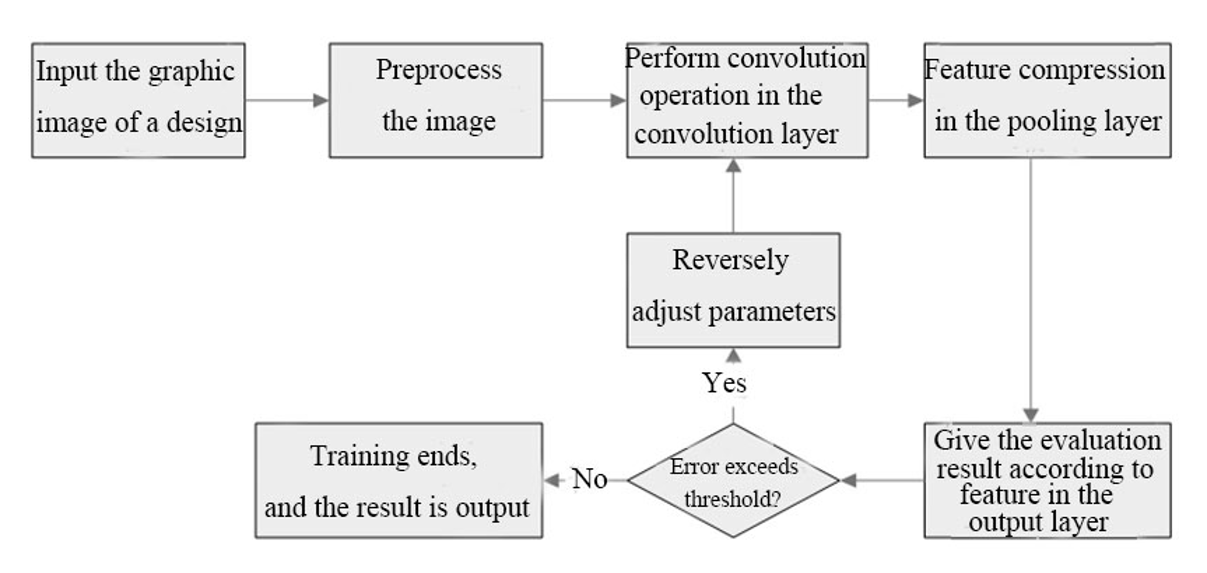
Step 1. The graphic image of the design was input and preprocessed to remove noises.
Setp 2. Convolution calculation was performed on the image using convolution kernels in the convolutional layer to obtain the convolutional feature map. The corresponding calculation formula is:
where [TeX:] $$x_j^l$$ stands for the convolutional feature map, [TeX:] $$x_i^{l-1}$$ is the feature output after the pooling of the i-th convolutional kernel in the last convolutional layer, [TeX:] $$W_{i j}^l$$ is the weight parameter between the i-th convolution kernel and the j-th convolution kernel, [TeX:] $$b_j^l$$ is the bias of j convolution kernels in l layers, M is the number of convolution kernels, and [TeX:] $$f(\bullet)$$ is the activation function.
Step 3. The convolution feature map was input into the pooling layer for compression. The compression meant sliding a pooling frame over the feature map. Multiple data in the pooling frame were merged into one. Pooling compression modes included max-pooling and mean-pooling.
Step 4. Inductive calculation was performed on the feature map in the output layer after multiple times of convolution and pooling. The evaluation result of the graphic design was output.
Step 5. The calculated evaluation result was compared with the expected evaluation result of the input sample to determine whether the error exceeds the preset threshold. If not, the training ended, and the weight parameter in the algorithm was fixed for evaluating designs; if it did, the weight parameter in the convolutional layer was reversely adjusted, and it returned to step 2.
This paper evaluated the design in Fig. 2 using the intelligent algorithm and manual evaluation. Before evaluating the design of Fig. 2 using the intelligent algorithm, the intelligent algorithm was trained and tested by the training and test sets. The result labels of the training and test sets were obtained using the analytic hierarchy process method. The method was also used for the manual evaluation of the design.
When using the analytic hierarchy process method to construct evaluation indicators for the sample, the finally obtained hierarchical indicators and corresponding weights are shown in Table 1 in the analysis results. The samples were scored according to the indicator system given in Table 1, and the final scores were calculated by combining the corresponding weights. The score of every index and the final score were the labels of the sample. A total of 1,000 samples were collected in this study, of which 70% were used as the training set and 30% as the test set. In addition to manual evaluation, the CNN algorithm was also compared to the SVM algorithm. The 1,000 samples were collected to train the evaluation algorithm and preliminarily verify the effectiveness of the evaluation algorithm, and the final purpose was to evaluate the two designs shown in Fig. 2.
The error between the computed result and the expected result of the sample was needed to adjust the weight parameter in the algorithm in the training process. The error used during the training of the CNN algorithm was the error between the indexes calculated by the algorithm, the comprehensive score, and the expected label of the sample. The performance test of the trained evaluation algorithm was carried out using the test set by the above error.
Table 1.
| Indicator | Value | ||
|---|---|---|---|
| Middle layer | Composition pattern | - | 0.3a |
| Color layout | - | 0.4a | |
| Text description | - | 0.3a | |
| Target layer | Composition pattern | Novel | 0.4a |
| Suitable | 0.6a | ||
| Color layout | Distinct | 0.4a | |
| Reasonable | 0.6a | ||
| Text description | Font fit | 0.5a | |
| Reasonable layout | 0.5a | ||
| Time of manual evaluation (min) | Design (1) | - | 30 |
| Design (2) | - | 30 | |
| Evaluation time of the SVM algorithm (min) | Design (1) | - | 2.5 |
| Design (2) | - | 2.3 | |
| Evaluation time of the CNN algorithm (min) | Design (1) | - | 1.5 |
| Design (2) | - | 1.4 |
a Hierarchical corresponding weights.
3.3 Analysis Results
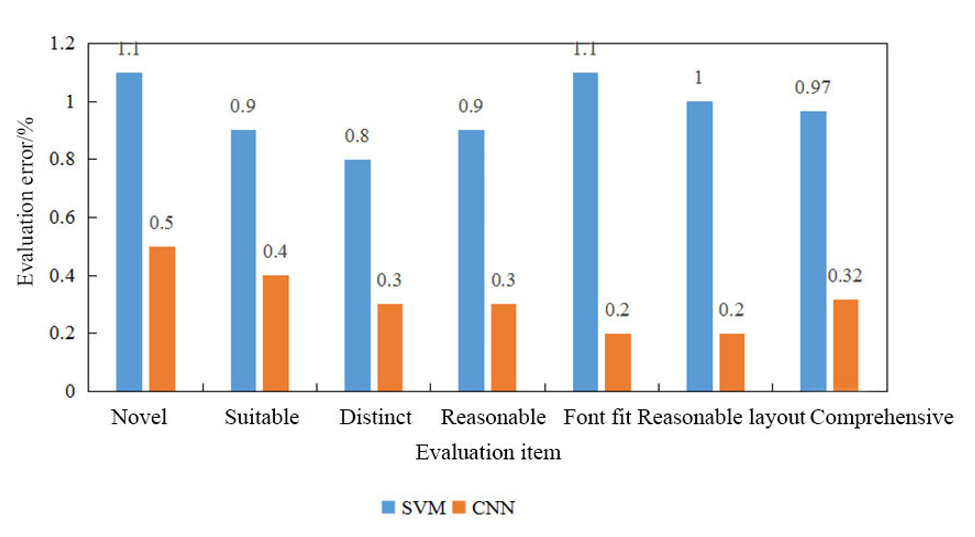
Fig. 4 shows the evaluation errors of SVM and CNN algorithms for the test samples after training. The specific values of the errors have been marked in Fig. 4. It was noticed in Fig. 4 that the evaluation errors of these algorithms for different indicators of the graphic design were different, and the evaluation errors of the SVM algorithm for the design were higher than those of the CNN algorithm on the whole.
The analytic hierarchy process method used in the manual evaluation and result labeling of the sample set divided the samples into three layers. The highest layer was the final score of the design. The middle layer was divided into composition pattern, text description, and color layout. The target layers under the composition pattern were the novel degree and suitable degree. The target layers under the color layout were the district degree and reasonable degree. The target layers under the text description were the degree of font fit and the reasonable degree of the layout. The weights of different items in the hierarchy are shown in Table 1. The scores of the manual evaluation and the CNN algorithm are shown in Fig. 5. After calculation, the final score of Design 1 was 7.36 under the manual evaluation, 7.20 under the CNN algorithm, and 7.03 under the SVM algorithm, and the final score of Design 2 was 7.70 under the manual evaluation, 7.85 under the CNN algorithm, and 7.37 under the SVM algorithm. In addition, the analytic hierarchy process method consumed 30 minutes to evaluate Design 1, the CNN algorithm consumed 1.5 minutes, and the SVM algorithm consumed 2.5 min; the analytic hierarchy process method consumed 30 minutes to evaluate Design 2, the CNN algorithm consumed 1.4 minutes, and the SVM algorithm consumed 2.3 minutes. It was concluded that the CNN algorithm had the highest efficiency in evaluating the designs.
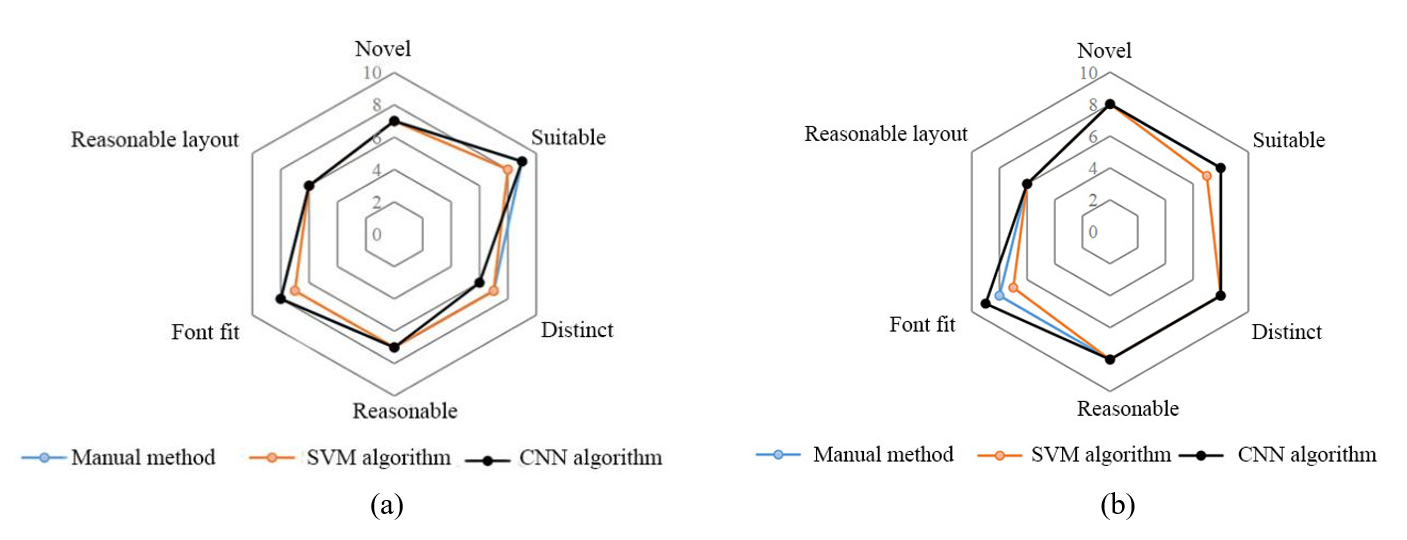
The scores of Designs 1 and 2 obtained by the manual evaluation and the CNN algorithm were close. The reason for the close scores was that both designs were similar in the overall design form and were different in the presentation form of some details. Moreover, the evaluation results of the manual evaluation and CNN algorithm further proved the effectiveness of the CNN algorithm.
4. Discussion
Adding traditional handmade graphic elements to a graphic visual communication design can enrich the elements of the design and strengthen the originality. In this paper, the graphic elements of the traditional Chinese paper-cut craft were added to the logo design for the 50th anniversary of Dezhou University. Then, when analyzing the logo design, in addition to the manual evaluation based on the analytic hierarchy process method, the trained CNN algorithm was also used, and it was compared with the SVM algorithm. As shown above, the CNN algorithm performed well in the test set, and the evaluation results obtained by the CNN algorithm were similar to the manual evaluation, which further verified that the CNN algorithm could replace the manual evaluation method in evaluating designs.
The two logo designs were analyzed in detail according to the evaluation results. Both Designs 1 and 2 were logo designs for the 50th anniversary of Dezhou University. The composition patterns and text descriptions of both designs were the same, and the difference between them was the color layout. Therefore, the same composition pattern and text description were analyzed at first. In the composition of the two designs, the elements of "de" (virtue), "50," "canal, and "teaching building" were combined; "de" was taken as the overall framework, the middle part of the right side of the character was replaced by "50," and the bottom part was replaced by a sketch element of "teaching building." The "5" in the "50" element was deformed by the "canal" element to make it closer to the winding canal, while the "0" element was designed as a circular college logo to emphasize the name of the college. The sketch element of "teaching building" was embodied by the form of books standing on the shelves to reflect the function of teaching and educating people. In addition, due to the use of the character "de" as the overall framework, the icon was square in shape, and the element of "paper cut" was introduced to specifically express the above elements, making the two designs look like paper-cut works. In the text descriptions, both of them indicated the establishment date of the college, and the indication was placed below the icon.
In terms of color layout, Design 1 adopted Yin cuts from the paper-cut technique, i.e., the background was a single red color, and the main body was hollowed out. This design also used the element of "seal," and the establishment date of the college below the icon was colored green in contrast to the red. Design 2 adopted Yang cuts from the paper-cut technique, i.e., the background was hollowed out, and the main body was colored. The element of "50" was designed in green to contrast with the red, highlighting the characteristic of the 50th anniversary.
5. Conclusion
This paper introduced visual communication and applications of traditional elements in visual communication design. The graphic element "paper cut" was applied to the logo design for the 50th anniversary of Dezhou University, and the designs were evaluated and analyzed using the analytic hierarchy process method and the CNN algorithm. The results are as follows. The test results of the trained CNN algorithm demonstrated that the CNN algorithm could effectively score the graphic design. The evaluation results of the CNN algorithm differed little from the manual evaluation results, but the SVM algorithm differed significantly from the manual evaluation, which further proved the effectiveness of the CNN algorithm, and the efficiency of the CNN algorithm was much higher than the manual method. The evaluation of the two logo designs using the analytic hierarchy process method and the CNN algorithm suggested that the designs made effective use of the graphic element "paper cut."

References
- 1 A. Yoxall, V . Gonzalez, J. Best, E. M. Rodriguez-Falcon, and J. Rowson, "As you like it: understanding the relationship between packing design and accessibility," Packaging Technology and Science, vol. 32, no. 10, pp. 496-507, 2019.doi:[[[10.1002/pts.2466]]]
- 2 S. Ji and P . S. Lin, "Aesthetics of sustainability: research on the design strategies for emotionally durable visual communication design," Sustainability, vol. 14, no. 8, article no. 4649, 2022. https://doi.org/10.3390/ su14084649doi:[[[10.3390/su14084649]]]
- 3 J. Miriam, N. Udin, and C. N. Latif, "Visual communication design of campaign to reduce plastic waste to protect mangrove by Pulauku Zero Waste," IOP Conference Series: Earth and Environmental Science, vol. 729, no. 1, article no. 012057, 2021. https://doi.org/10.1088/1755-1315/729/1/012057doi:[[[10.1088/1755-1315/729/1/01]]]
- 4 C. V elasco, A. T. Woods, and C. Spence, "Evaluating the orientation of design elements in product packaging using an online orientation task," Food Quality and Preference, vol. 46, pp. 151-159, 2015.doi:[[[10.1016/j.foodqual.2015.07.018]]]
- 5 G. Y uan, Q. Xie, and W. Pan, "Color design based on Kansei engineering and interactive genetic algorithm," Academic Journal of Manufacturing Engineering, vol. 15, no. 3, pp. 12-18, 2017.custom:[[[-]]]
- 6 A. Sirimamilla, H. Ye, and Y . Wu, "Phenomenological modeling of carpeted surface for drop simulation of portable electronics," Journal of Electronic Packaging, vol. 141, no. 2, article no. 021006, 2019. https://doi.org/10.1115/1.4042978doi:[[[10.1115/1.4042978]]]
- 7 L. Qian, Y . Xia, X. He, K. Qian, and J. Wang, "Electrical modeling and characterization of silicon-core coaxial through-silicon vias in 3-D integration," IEEE Transactions on Components, Packaging and Manufacturing Technology, vol. 8, no. 8, pp. 1336-1343, 2018.doi:[[[10.1109/tcpmt.2018.2854829]]]
- 8 D. Kumoratih, G. Anindita, I. Ariesta, and E. Tholkhah, "The role of visual communication design to increase public literacy on the history of Spice Route in supporting Indonesia’s proposal toward UNESCO’s World Cultural Heritage," IOP Conference Series: Earth and Environmental Science, vol. 729, no. 1, article no. 012107, 2021. https://doi.org/10.1088/1755-1315/729/1/012107doi:[[[10.1088/1755-1315/729/1/01]]]
- 9 Y . Ying and S. Y ue, "Research on visual communication graphic design information system based on computer simulation," Journal of Physics: Conference Series, vol. 1952, no. 2, article no. 022032, 2021. https://doi.org/10.1088/1742-6596/1952/2/022032doi:[[[10.1088/1742-6596/1952/2/02]]]
- 10 Q. Xie, Q. Zhao, Z. Xu, and D. Meng, "Color and direction-invariant nonlocal self-similarity prior and its application to color image denoising," Science China (Information Sciences), vol. 63, no. 12, pp. 83-99, 2020.doi:[[[10.1007/s11432-020-2880-3]]]
- 11 J. K. Min and J. H. Lee, "A study on the specialized color plan of industrial complex reflecting local identity according to intergrated design communication: focused on Gimpo Goldvalley Industrial Complex," Journal of the Korean Society Design Culture, vol. 22, no. 3, pp. 169-182, 2016.custom:[[[https://www.kci.go.kr/kciportal/ci/sereArticleSearch/ciSereArtiView.kci?sereArticleSearchBean.artiId=ART002148670]]]
- 12 A. K. Bhandari, A. Kumar, S. Chaudhary, and G. K. Singh, "A novel color image multilevel thresholding based segmentation using nature inspired optimization algorithms," Expert Systems with Applications, vol. 63, pp. 112-133, 2016.doi:[[[10.1016/j.eswa.2016.06.044]]]
- 13 D. Lee and K. N. Plataniotis, "Toward a no-reference image quality assessment using statistics of perceptual color descriptors," IEEE Transactions on Image Processing, vol. 25, no. 8, pp. 3875-3889, 2016.doi:[[[10.1109/tip.2016.2579308]]]
- 14 C. Li, J. Guo, and C. Guo, "Emerging from water: Underwater image color correction based on weakly supervised color transfer," IEEE Signal Processing Letters, vol. 25, no. 3, pp. 323-327, 2018.doi:[[[10.1109/lsp.2018.2792050]]]