Ying Huang and Yusheng Jiao
The Determinants and their Time-Varying Spillovers on Liquefied Natural Gas Import Prices in China Based on TVP-FAVAR Model
Abstract: China is playing more predominant role in the liquefied natural gas (LNG) market worldwide and LNG import price is subject to various factors both at home and abroad. Nevertheless, previous studies rarely heed a multiple of factors. A time-varying parameter factor augmented vector auto-regression (TVP-FAVAR) model is adopted to discover the determinants of China’s LNG import price and their dynamic impacts from January 2012 to December 2021. According to the findings, market fundamentals have a greater impact on the import price of natural gas in China than overall economic demand, financial considerations, and world oil prices. The primary determinants include domestic gas consumption, consumer confidence and other demand-side information. Then, there are diverse and time-varying spillover effects of the four common determinants on the volatility of China's LNG import price at different intervals and time nodes. The price volatility is more sensitive and long-lasting to domestic natural gas pricing reform than other negative shocks such as the Sino-US trade war and the COVID-19 pandemic. The results in this study further proves the importance of domestic natural gas market liberalization. China ought to do more to support the further marketization of natural gas prices while working harder to guarantee natural gas supplies.
Keywords: Aggregate Demand , Crude Oil Market , Financial Speculation , Liquefied Natural Gas Import Prices , Market Fundamentals , TVP-FAVAR Model
1. Introduction
As a clean and efficient fossil energy, natural gas (NG) is significant component of the world's oil and gas trade and it is used as a major transitional fuel in restructuring China’s energy mix and realizing the dual carbon goals. In 2021, China’s NG consumption exceeded 372.6 billion cubic meters and more than 40% of the NG came from imports. The amount of liquefied natural gas (LNG), which accounts for 65% of total NG imports and has a volume of 79.93 million tons, is contributing to China's increasing NG consumption. China is especially susceptible to paying higher prices and experiencing more price swings despite the enormous demand for LNG due to its lack of pricing power and strong competitiveness in the global energy market. Growing geopolitical tensions, the Russia-Ukraine war, and the coronavirus disease 2019 (COVID-19) pandemic have all contributed to the seriousness of this trend in recent years [1,2].
The relationship between oil and gas prices has been covered in a lot of literature. While some have shown a steady long-term link [3], others have shown a dynamic association in various time scales and geographical markets [4,5]. Furthermore, the short-term market imbalance [6], variations in wintertime temperatures [7], and extreme weather occurrences [8] are all linked to changes in gas prices. The fluctuations in gas prices in Germany, the United States, and Japan are influenced by a variety of dynamic market fundamentals [5]. The prices of LNG imports into China have been less dependent on oil indexation and more dependent on information from the domestic market [9,10]. Recent studies often take into account competition from alternative energy sources and financial considerations. There is a growing influence on the volatility of NG prices from the stock market [11] and financial speculation [12]. In the three largest NG markets in the world, financialization is a crucial tool for advancing a single pricing mechanism [13]. The competition from alternative energy sources has a significant impact on risk spillovers in the coal, NG, and crude oil markets [14,15]. The premium level of imported LNG is dominated by the price of coal from China [10]. Furthermore, the determination of NG price involves an analysis of macroeconomic uncertainty [16], bargaining ability [17], and geopolitical considerations [1,18].
China is the largest LNG importer in the world as of 2021 [19]. It suggests that the domestic LNG market is having a bigger and bigger influence on other countries. However, it is rarely acknowledged what drives the cost of China's LNG imports [10]. These studies indicate that it is influenced by a number of factors both domestically and internationally. The primary causes and their effects change with time. However, in order to study NG pricing from a single factor, earlier research primarily used the vector auto regression (VAR) approach [3,5], the structural vector auto regression (SVAR) model [15,16], or the vector error correction model (VECM) [9], and they sporadically focused on their time-varying affects [10]. We use the time-varying parameter factor augmented vector auto-regression (TVP-FAVAR) method to investigate several factors that influence China's LNG import price and their dynamic effects between January 2012 and December 2021 in order to close this gap. It is very helpful for strengthening LNG import safety and China's NG pricing liberalization.
2. Methodology and Data
2.1 TVP-FAVAR Model Construction
The TVP-FAVAR method was first proposed by Korobilis [20] and used to simulate monetary policy shocks. It is expanded to estimate energy market security and identify the economic policy uncertainty (EPU) spillovers [21,22]. Unlike many conventional forecasting models, the TVP-FAVAR technique uses a dynamic factor augmentation method and benefits from time change in both regression coefficients and associated random fluctuations. As a result, we may investigate several factors influencing the cost of LNG imports and their dynamic effects throughout China's green transformation. Based on the research of Kilian [23], Zhang et al. [5] and Shi and Shen [16],this study decomposed LNG import price shocks into four parts, including market fundamentals, aggregate demand, financial speculation and crude oil market. The price volatility brought on by changes in NG output, consumption, and inventory is referred to as "market fundamentals shock." The term "aggregate demand shock" describes price changes brought on by global economic activities. The price volatility caused by speculation is referred to as financial speculation shock. A crude oil market shock is a price fluctuation brought on by shifts in the supply and demand of crude oil.
Thus, a FAVAR model is used to integrate 25 economic indicators in a unified framework, including NG production and consumption, global economic activities, financial speculation, crude oil supply and demand. By the factor analysis method, common components are retrieved to assess the volatility of LNG import prices [24]. Ultimately, a TVP-FAVAR model is constructed by combining the FAVAR and TVPVAR models.
A time-varying coefficient TVP-VAR model [25] with stochastic volatilities is adopted to investigate the dynamic effects of several structural shocks on China's LNG import prices.
First, a VAR model with time-varying parameters is constructed.
(1)
[TeX:] $$\begin{gathered} Y_t=B_{1 t} Y_{t-1}+B_{2 t} Y_{t-2}, \ldots+B_{p t} Y_{t-p}+A_t^{-1} \sum_t \varepsilon_t \\ \varepsilon_t \sim N\left(0, I_k\right), t=p+1, \ldots, n \end{gathered}$$where [TeX:] $$Y_t$$ is a k × 1 vector of observed variables, and [TeX:] $$Y_{t-p}$$ represents the p-th lag of Y. [TeX:] $$B_{1 t}, \ldots, B_{p t}$$ are k × k matrices of time-varying coefficients. [TeX:] $$A_t$$ refers to the contemporaneous structure relationship of variables and [TeX:] $$\Sigma_t$$ is the covariance of error disturbance term [TeX:] $$\varepsilon_t$$. I is the identity matrix. As mentioned above, in the model, the dimensions of the determinants behind China’s LNG import prices should be reduced, as follows.
(2)
[TeX:] $$\begin{gathered} X_t=\Lambda^f F_t+\Lambda^y Y_t+e_t \\ e_t \sim N(0, H) \end{gathered}$$where [TeX:] $$X_t$$ is n × 1 determinant data set. [TeX:] $$F_t$$ is a common factor extracted from the determinant data set affecting China’s LNG import prices based on principal component analysis, which includes most of the information of [TeX:] $$X_t$$. [TeX:] $$\Lambda^f \text { and } \Lambda^y$$ are factor load matrices of [TeX:] $$F_t \text { and } Y_t \text {, }$$ respectively. [TeX:] $$H=\operatorname{diag}\left(\exp \left(h_1\right), \ldots, \exp \left(h_n\right)\right)$$. The common factor [TeX:] $$F_t$$ is placed into the model (1) as follows.
(3)
[TeX:] $$\begin{gathered} {\left[\begin{array}{l} F_t \\ Y_t \end{array}\right]=B_{t, 1}\left[\begin{array}{l} F_{t-1} \\ Y_{t-1} \end{array}\right]+\cdots+B_{t, p}\left[\begin{array}{c} F_{t-p} \\ Y_{t-p} \end{array}\right]+A_t^{-1} \sum_t \varepsilon_t} \\ \varepsilon_t \sim N\left(0, I_k\right) \end{gathered}$$Eqs. (2) and (3) add common factors on the basis of Eq. (1) to form a TVP-FAVAR model. According to Eq. (3), the coefficients of dynamic lag term [TeX:] $$B_{t, j}, j=1, \ldots, p$$ random disturbance term [TeX:] $$\varepsilon_t \text {, }$$ and contemporaneous relationship of model variables [TeX:] $$A_t$$ are time-varying. The coefficient matrix of dynamic lag term is iterated with the contemporaneous relationship matrix of model variables to express these time-varying features. Define [TeX:] $$\beta_t=\left(C_t, \operatorname{vec}\left(B_{t, 1}\right)^{\prime}, \operatorname{vec}\left(B_{t, 2}\right)^{\prime}, \ldots, \operatorname{vec}\left(B_{t, j}\right)^{\prime}\right)^{\prime},$$ which is a [TeX:] $$(k \times 1)^2 \mathrm{p} \times 1$$ time-varying coefficient vector. In order to effectively identify the model parameters, assume [TeX:] $$A_t$$ is a lower-triangular matrix with the diagonal elements equal to one, and [TeX:] $$\Sigma_t$$ is a diagonal matrix as follows.
(4)
[TeX:] $$A_t=\left(\begin{array}{ccccc} 1 &0 &\cdots &0 &0 \\ \alpha_{21, t} &1 &\cdots &0 &0 \\ \vdots &\vdots &\ddots &\vdots &\vdots \\ \alpha_{k 1, t} &\cdots &\cdots &\alpha_{k k-1, t} &1 \end{array}\right) \Sigma_t=\left(\begin{array}{cccc} \sigma_{1, t} &0 &\cdots &0 \\ 0 &\sigma_{2, t} &\cdots &0 \\ \vdots &\vdots &\ddots &\vdots \\ 0 &\cdots &\cdots &\sigma_{k, t} \end{array}\right)$$The non-zero and non-one elements are straightened in the matrix at horizontally so that [TeX:] $$\alpha_t=\left(a_{21, t}, a_{31, t}, a_{41, t}, \ldots, a_{k k-1, t}\right)^{\prime}$$, [TeX:] $$\alpha_t=\left(a_{21, t}, a_{31, t}, a_{41, t}, \ldots, a_{k k-1, t}\right)^{\prime}$$, where [TeX:] $$h_t=\log \sigma_{j t}^2, j=1, \ldots, k+1 \text { and } t=p+1 \ldots, n$$. According to Primiceri [25] and Nakajima [26], the first-order random walk is used to describe the dynamic features of the lag term coefficients, synchronization relationship and random disturbance term of the model, which are expressed as follows:
(5)
[TeX:] $$A_t=\left(\begin{array}{ccccc} 1 &0 &\cdots &0 &0 \\ \alpha_{21, t} &1 &\cdots &0 &0 \\ \vdots &\vdots &\ddots &\vdots &\vdots \\ \alpha_{k 1, t} &\cdots &\cdots &\alpha_{k k-1, t} &1 \end{array}\right) \Sigma_t=\left(\begin{array}{cccc} \sigma_{1, t} &0 &\cdots &0 \\ 0 &\sigma_{2, t} &\cdots &0 \\ \vdots &\vdots &\ddots &\vdots \\ 0 &\cdots &\cdots &\sigma_{k, t} \end{array}\right)$$I is the identity matrix. [TeX:] $$\Sigma_\beta, \Sigma_\alpha, \text { and } \Sigma_h$$ are assumed to be positive definite matrices. According to the research of Nakajima [26], the relevant parameters of the model are estimated based on Bayesian framework and Markov chain Monte Carlo (MCMC) algorithm. Stata 17.0 and OxMetrics 6.01 are used to estimate the above equations and obtain impulse response graphs of the TVP-FAVAR model.
2.2 Data Selection and Pre-processing
Based on the research of Shi and Shen [16] and Feng et al. [27], indicators from such categories are selected as NG production and consumption, global economic activities, financial factors, and oil production and demand to reflect the shocks of market fundamentals, aggregate demand, financial speculation and crude oil market. Since the Chinese officially start to consume NG and LNG in January 2012, the sample is selected from January 2012 to December 2021.
Table 1.
| Shock category | Variable | Data source |
|---|---|---|
| Natural gas market fundamentals shock | NG production | Monthly Bulletin of Statistics Online |
| U.S. ending stocks of NG liquids | Energy Information Administration | |
| U.S. NG plant stocks of NG liquids | ||
| China’s apparent consumption of NG | China National Development and Reform Commission | |
| China’s LNG consumption | China Customs Statistics | |
| China’s consumer confidence index | China economic network statistical database | |
| Aggregate economic demand shock | Japan’s industrial production index | China economic network statistical database/OECD monthly database |
| South Korea’s industrial production index | ||
| U.S. industrial production index | ||
| OECD industrial production index | ||
| G7 industrial production index | ||
| China’s industrial production index | ||
| Euro zone industrial production index | ||
| Global economic policy uncertainty | Economic Policy Uncertainty | |
| Baltic dry bulk index (BDI) | Wind database | |
| Financial speculation shock | US Standard & Poor’s 500 volatility index (VIX) | Wind database |
| Proportion of non-commercial positions in NG | ||
| China’s M2 supply | China economic network statistical database | |
| Exchange rate of US dollar against RMB | ||
| China’s foreign exchange reserves | ||
| Brent, Texas and Dubai crude oil price index | IMF/Primary Commodity Price System | |
| European, Japanese, and American NG price indices | ||
| Crude oil market shock | Crude oil production | Monthly Bulletin of Statistics Online |
| U.S. ending stocks of crude oil | Energy Information Administration | |
| Crude oil transportation index (BDTI) | Wind database |
As shown in Table 1, the total of these NG outputs from the United States, Canada, Russia, China, and Norway makes up 52.5% of the world's total production in 2020. The whole output of crude oil in 2020— 59.5%—comes from the United States, Canada, Russia, Saudi Arabia, China, Mexico, Norway, and Nigeria. China's LNG consumption is computed as follows: imports less exports of LNG + China's own LNG output.
First, we combine all of the original data into monthly data with the same unit as required by the model. Next, the augmented Dickey-Fuller (ADF) test is used to analyze all variables after processing some of them using the natural logarithm. Lastly, a correlation analysis is performed to guarantee the efficacy and stability of every variable.
3. Analysis on Model Estimation Results
3.1 Common Factor Extraction Results
This paper uses principal component analysis to select four major factors with eigenvalues greater than 1 as the proxy variables of shocks on China’s LNG import price. The cumulative interpretation proportion reaches 83.43%, as shown in Table 2.
Based on the aforementioned findings, all variables undergo ordinary least squares (OLS) regression in order to investigate the economic implications of each primary factor. The economic implications of the top five indices with the best goodness of fit are interpreted. As can be seen in Table 3, Factor 1 illustrates the influence of the fundamentals of the NG market by reflecting China's consumption of NG and LNG as well as worldwide NG production. Factor 2 represents aggregate demand shock and is indicative of global economic activity. Factor 3 represents financial speculation shock and is correlated with the energy price index and stock market volatility index. Factor 4 represents the shock to the oil market and is related to the production of crude oil and its transportation price index. Table 2 illustrates that Factor 1's interpretation proportion is 42.24%, whereas Factors 2, 3, and 4's interpretation proportions are 22.02%, 11.77%, and 7.39%, respectively. As a result, NG market information shocks have a greater impact on the price of China's imported LNG than on overall demand, monetary variables, or worldwide oil prices. The main drivers are proven to be domestic gas consumption, the consumer confidence index, and other demand-side data. The oil market's influence is waning [9,10].
Table 2.
| Eigenvalue | Difference | Proportion | Cumulative | |
|---|---|---|---|---|
| Factor 1 (F1) | 9.71599 | 4.65051 | 0.4224 | 0.4224 |
| Factor 2 (F2) | 5.06548 | 2.35739 | 0.2202 | 0.6427 |
| Factor 3 (F3) | 2.70809 | 1.00948 | 0.1177 | 0.7604 |
| Factor 4 (F4) | 1.69861 | 0.75870 | 0.0739 | 0.8343 |
Table 3.
| Indicator | [TeX:] $$R^2$$ | |
|---|---|---|
| Factor 1 (F1) | China’s LNG consumption | 0.3087 |
| NG production | 0.3053 | |
| China’s apparent consumption of NG | 0.3034 | |
| China’s consumer confidence index | 0.2903 | |
| US ending stocks of NG liquids | 0.2702 | |
| Factor 2 (F2) | G7 industrial production index | 0.4216 |
| US industrial production index | 0.4169 | |
| Japan’s industrial production index | 0.3630 | |
| OECD industrial production index | 0.3484 | |
| Euro zone industrial production index | 0.3416 | |
| Factor 3 (F3) | Baltic dry bulk index (BDI) | 0.4344 |
| European, Japanese, and American NG price indices | 0.3546 | |
| Brent, Texas and Dubai crude oil price index | 0.2863 | |
| China’s industrial production index | 0.2825 | |
| US Standard & Poor’s 500 volatility index | 0.1602 | |
| Factor 4 (F4) | crude oil production | 0.5761 |
| crude oil transportation index (BDTI) | 0.4444 | |
| China’s foreign exchange reserves | 0.3022 | |
| US Standard & Poor’s 500 volatility index | 0.1977 | |
| Brent, Texas and Dubai crude oil price index | 0.1035 |
3.2 Analysis of MCMC Simulation Results
A lag second-order model is established to stimulate ten thousand times through the MCMC algorithm to get reliable samples. Table 4 describes the estimation results of model stability. The mean of the posterior distribution of relevant parameters is among the 95% confidence interval. Since all of the Geweke diagnostic values fall below 1.96, the original theory of a posteriori distribution's convergence can be accepted. The parameter estimation results using the MCMC technique are effective, as seen by the six estimate outcomes with inefficiencies all below 100.
Table 4.
| Parameter | Mean | SD | 95% CI | Geweke convergence diagnostics | Inefficiency | |
|---|---|---|---|---|---|---|
| Lower | Upper | |||||
| [TeX:] $$\left(\Sigma_\beta\right)_1$$ | 0.0226 | 0.0025 | 0.0182 | 0.0282 | 0.484 | 6.11 |
| [TeX:] $$\left(\Sigma_\beta\right)_2$$ | 0.0228 | 0.0026 | 0.0183 | 0.0287 | 0.205 | 6.60 |
| [TeX:] $$\left(\Sigma_\alpha\right)_1$$ | 0.0716 | 0.0229 | 0.0411 | 0.1304 | 0.444 | 37.24 |
| [TeX:] $$\left(\Sigma_\alpha\right)_2$$ | 0.0855 | 0.0334 | 0.0427 | 0.1699 | 0.951 | 42.97 |
| [TeX:] $$\left(\Sigma_h\right)_1$$ | 0.1584 | 0.0654 | 0.0678 | 0.3141 | 0.248 | 70.09 |
| [TeX:] $$\left(\Sigma_h\right)_2$$ | 0.5221 | 0.1276 | 0.3152 | 0.8106 | 0.462 | 30.13 |
3.3 Time Varying Spillovers of Various Factor Shocks on China’s LNG Import Prices in Different Time Lengths
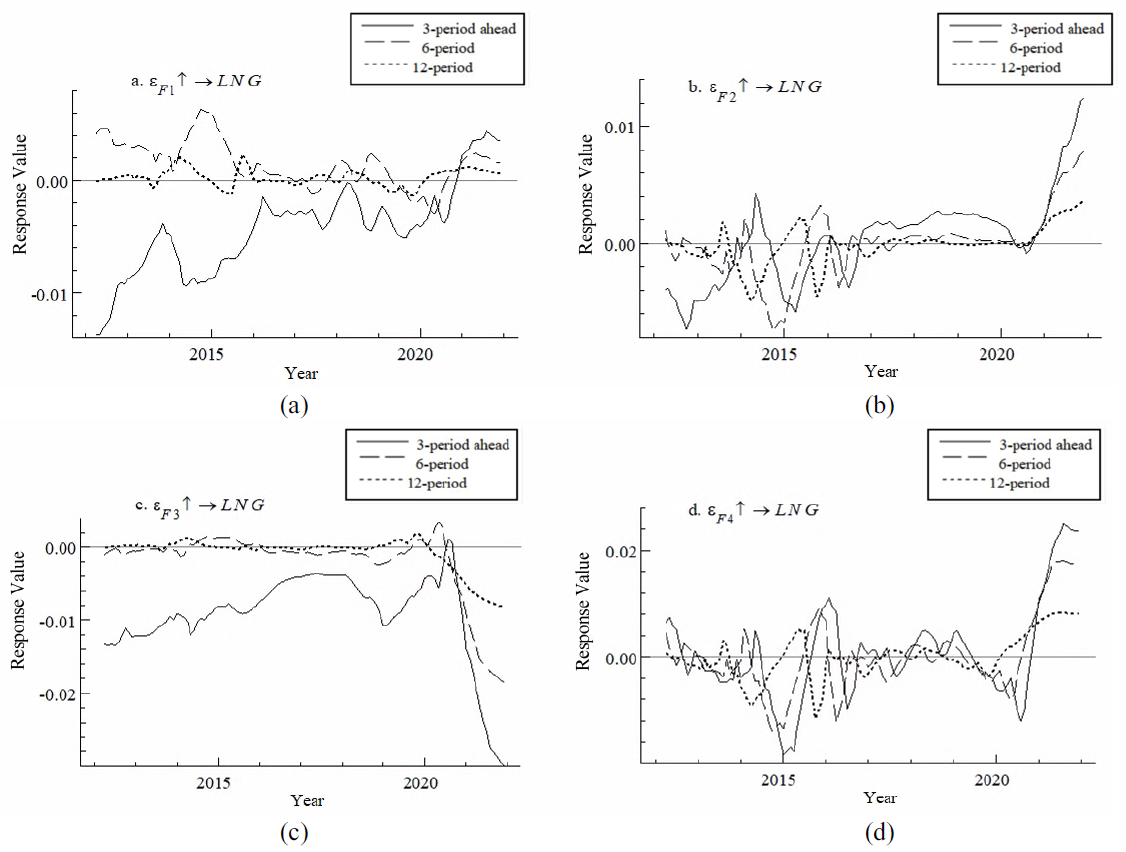
Fig. 1 displays graphs that illustrate the dynamic impulse responses of China's price yield on LNG imports to the fundamentals of the NG market, aggregate demand, financial speculation and the oil market over different time periods. The chosen lag times, which stand for the short-, medium-, and long-runs, are 3, 6, and 12 months. Over time, the spillover effects shift. In the short-term, there is a significant reaction degree, but over time, not much.
The short-run impulse response in Fig. 1(a) is increasing in wave and remains negative for the most part of the time. Between October 2013 and April 2014, there is a significant decline, and in October 2020, it rises to positive. Fundamentals of the NG market have a short-term restraint. China changed its net-back pricing policy for natural gas in 2014 from cost-plus pricing, which effectively created market competition and lowered the price of LNG imported and sold domestically [28]. But the COVID-19 pandemic made things difficult in the market. The rising cost of NG drives up the price of imported LNG. The positive medium- and long-term responses suggest that rising NG demand will eventually raise the price of imported LNG. The responses in graph b continue to fluctuate wildly over time. The demand drops before September 2016 and then reduces. From 2013 to 2016, China’s insufficient demand and overcapacity in manufacturing restrain the volatility growth. October 2016 saw a resurgence of the world economy. Growing economic demand has been the main driver of price yield. August 2020 marks a significant increase in responses. Policies aimed at combating the COVID-19 that expand demand on a large scale raise prices. The reactions in graph c are mostly negative in the short and medium terms, and they continue to fluctuate about zero over the long-term. The price yield is hampered in the short- and medium-term by financial speculation. Speculation provides a buffer against the risks of bubble or price disruption in the energy market. Over time, it makes little difference. The global oil market's spillovers to China's imported LNG industry are primarily negative prior to August 2015 and favorable thereafter, as seen in Fig. 1(d).
Fig. 1.
3.4 Time Varying Impacts of Various Factor Shocks on China’s LNG Import Prices at Certain Time Points
The volatility of NG prices is mostly influenced by economic events and policy. Increased uncertainty, increased consumption, and a scarcity of supply are all possible causes of rising prices. Therefore, significant occurrences like the COVID-19 pandemic (December 2019), the Sino-US trade war escalation (June 2018), and China's NG pricing reform (January 2014) [9,10] are planned to be studied at certain time nodes.
The dynamic impulsive responses of China's LNG import price yield to market fundamentals, aggregate demand, financial speculation, and the oil market at particular time points are shown in the graphs in Fig. 2. In graph a, the reactions in phases 1–3 oscillate dramatically about zero. The short-run reaction degree is especially notable during China's NG price reform, with the coefficient fluctuating between -0.025 and 0.035. Since January 2014 when China’s NG price reform was fully implemented, market information is increasingly influential on the costs of China’s imported LNG. The weak market fundamentals in March 2014 caused the price yield to turn negative, which led to a short- and mediumterm price fall. The answer in the long-run converges positively. Reactions to the Sino-US trade war have been largely favorable, suggesting that trade conflict increases EPU and drives up the price of China's imported LNG. The response fluctuates throughout phases 1–3 of the pandemic but stays negative in the medium- to long-term.
Fig. 2.
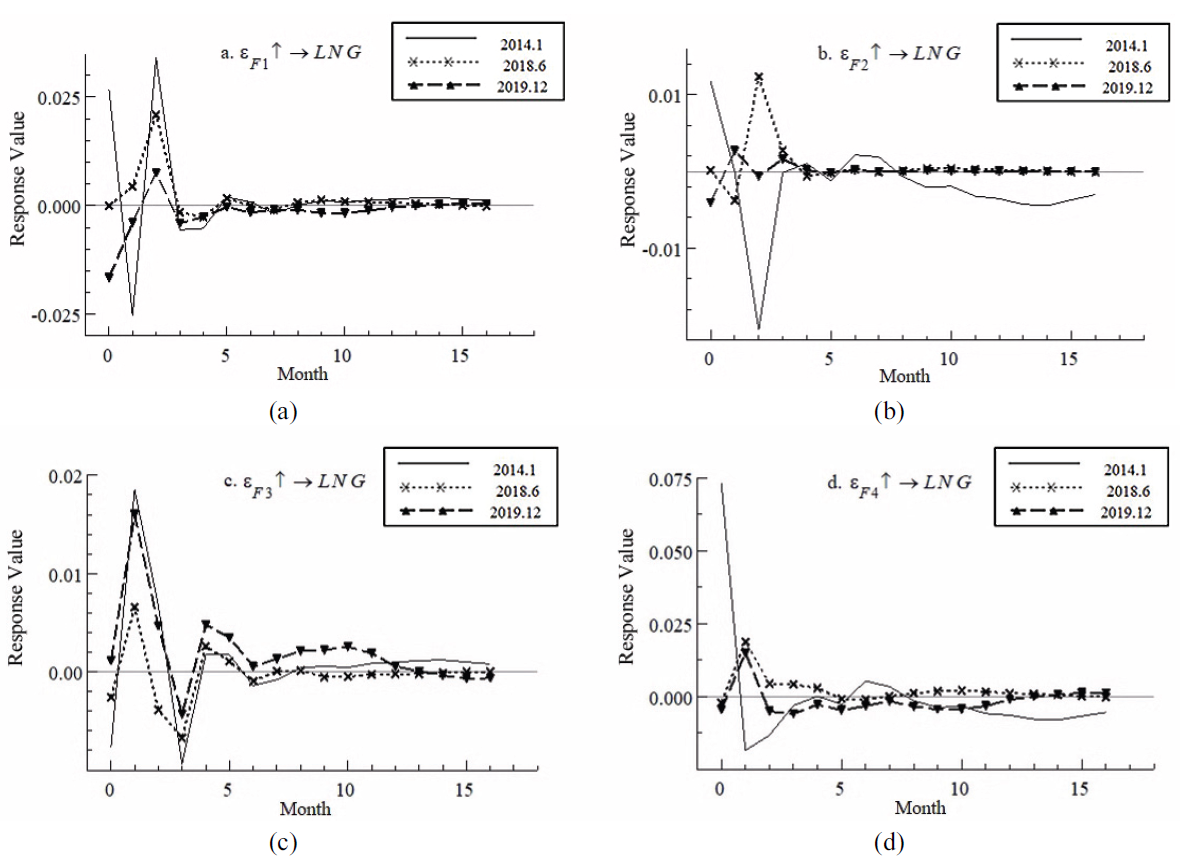
In Fig. 2(b), the response to China's NG price reformation is negative in the short-term, positive in the medium-term, and negative in the long-term. As the overall demand rises, the price yield of imported LNG decreased quickly due to the marketization of NG pricing. In the long-run, it is restrained but recovers in the mid-term. In the medium term, the responses to the COVID-19 shock and trade friction are largely positive. The increasing trade friction makes EPU more intense, which raises the price of LNG imports. Despite falling prices, the pandemic's demand-stimulating measures quickly lessened their negative effects. The answers are convergent throughout the medium and long terms.
In Fig. 2(c), during China’s NG price reformation, the reaction degree is large, with the coefficient closing to 0.02 in phase 1 and -0.01 in phase 3. Following that, it exhibits negative in phases 4 and 6–8, although it eventually maintains a generally favorable trend. It is evident that the reform of gas pricing has a significant impact on the price yield of LNG imports, causing it to fluctuate sharply due to increased financial uncertainty. Given that financial speculation can be used to mitigate price volatility risks in the energy market, the mid-term negative reaction indicates that financial speculation has a suppressive influence on the price yield. Over time, it makes little difference. The response is mostly positive to the COVID-19 shock; in phase 1, the coefficient reaches 0.015, and it reaches -0.005 in phase 3. Out of the three events, the medium- and long-run responses maintain a reaction degree over zero. Speculators were first pessimistic about energy costs due of the epidemic, but they later became optimistic. Phases 1–6 of the response wave and then converge during the trade war. Friction increases EPU, undermines financial stability, and soon causes price fluctuations. Over an extended period, financial speculating plays a minimal role.
In Fig. 2(d), China’s NG price has been changed significantly. It is mostly negative over time. In phase 1, the coefficient decreases from 0.073 to -0.02, then progressively increases to 0.005 in phase 6, before going negative once more in phase 8. China's LNG import prices fell in the near term, rose in the midterm, and were restrained in the long-run throughout the reform. The positive reaction to the trade war demonstrates that trade friction increases EPU and raises the cost of importing LNG and oil. In pandemics, the response shifts from positive to negative in phase 2, remains negative then and turns positive once more in phases 14–16. The oil market has a reversal effect on price yield in the short- and medium-term, which lowers the price of LNG imports. Over time, prices rise again.
4. Conclusion
Based on a TVP-FAVAR model, this paper has examined the key factors in determining prices for China’s LNG imports and dynamic spillover effects. Conclusions have been drawn as follows.
First, compared to overall economic demand, financial considerations, and worldwide oil prices, China's import costs for LNG are more susceptible to shocks resulting from the fundamentals of the NG market. The primary factors have been confirmed to be domestic gas consumption, consumer confidence, and other demand-side data. As gas pricing gets more liberalized, domestic fundamental information is increasingly influential on LNG import cost relative to the global oil market [9,10]. China should therefore continue to marketize the NG pricing mechanism in order to establish a competitive gas market and bolster the influence of the trading hubs in Shanghai, Chongqing, and Shenzhen. In order to increase their negotiating leverage when it comes to LNG, importers from China, Japan, and South Korea should concentrate on gathering market intelligence in Europe and Asia and fortify their cooperation [17]. Second, the spillovers of four common factors on price volatility for China’s LNG import are various and time-varying in different time lengths. Market fundamentals have negative influence in the short-term but positive in the middle to long run. Prior to September 2016, aggregate demand primarily had negative spillovers; after that, it had positive spillovers. Short- and medium-term effects of financial speculation are adverse, but long-term effects are negligible. Prior to August 2015, the crude oil market primarily had negative effects; after that, positive ones. Domestic gas demand has been demonstrated to be a primary driver and to have a non-negligible effect on China's LNG import cost in the medium to long run. In order to better address market imbalance, stabilize gas prices, and protect China's NG security, it is imperative to expand NG storage and supply capacity. The Chinese government's “14th five-year plan” expressly states this objective, which aims to direct the future growth of the NG industry [29]. Third, the spillovers at specific time points are time varying, with obvious heterogeneity in the reaction direction, degree and duration. According to this study, the biggest reaction degree and longest duration are experienced by the spillovers during the reform of the NG pricing system. Research indicates that, in comparison to other adverse shocks like the trade war and the COVID-19 epidemic, the price volatility of China's imported LNG is more susceptible to NG pricing reform [28]. During the trade war, oil prices, aggregate demand, and market information all contributed more than they did during the pandemic. Compared to trade friction, the pandemic's financial elements contributed more during that time. Therefore, China should keep accelerating market-oriented pricing, and encouraging the sound growth of NG trading centers especially in recent years because highly liberalized hubs can better cope with extreme risks [30]. Recently, extreme events have significantly amplified the uncertainty of energy markets and spillover effects [1]. Future study on the combination of the TVP-FAVAR model with dynamic model averaging (DMA) may yield improved analysis and prediction. Competition from alternative energy sources is also a topic that comes up a lot these days. The phase-out of coal and the expansion of renewable energy sources are essential to achieving the "Dual Carbon" aim, and NG serves as a link in China's low-carbon economic transformation. As a result, future research should examine how the prices of LNG, renewable energy, and coal interact.
Biography
Ying Huang
https://orcid.org/0009-0003-1992-3323
She received B.S. degree in economics from Hubei Economic Institute in 2004, M.S. and Ph.D. degrees in School of economics from Zhongnan University of Economics and Law in 2007 and 2012, respectively. She is currently a professor in the Department of Economic and Management, Wuchang Shouyi University, Wuhan, China. Her research interests include operational research model and application.
Biography
Yusheng Jiao
https://orcid.org/0000-0001-8770-848X
He received B.S. degree in economics from Henan Normal University in 1999, M.S. and Ph.D. degrees in School of economics from Zhongnan University of Economics and Law in 2007 and 2012, respectively. He is currently a professor in the Department of Economic and Management, Wuchang Shouyi University, Wuhan, China. His research interests include uncertain system and optimization algorithm.
References
- 1 X. Wang, J. Wang, W. Wang, and S. Zhang, "International and Chinese energy markets: dynamic spillover effects," Energy, vol. 282, article no. 128724, 2023. https://doi.org/10.1016/j.energy.2023.128724doi:[[[10.1016/j.energy.2023.128724]]]
- 2 M. Akhtaruzzaman, S. Boubaker, M. Chiah, and A. Zhong, "COVID−19 and oil price risk exposure," Finance Research Letters, vol. 42, article no. 101882, 2021. https://doi.org/10.1016/j.frl.2020.101882doi:[[[10.1016/j.frl.2020.101882]]]
- 3 H. Li and F. Qiao, "Research on the relationship between international crude oil price fluctuation and China's LNG import prices," Prices Monthly, vol. 2021, no. 7, pp. 18-25, 2021. https://doi.org/10.14076/j.issn.10062025.2021.07.03doi:[[[10.14076/j.issn.10062025.2021.07.03]]]
- 4 J. B. Geng, Q. Ji, and Y . Fan, "The relationship between regional natural gas markets and crude oil markets from a multi-scale nonlinear Granger causality perspective," Energy Economics, vol. 67, pp. 98-110, 2017. https://doi.org/10.1016/j.eneco.2017.08.006doi:[[[10.1016/j.eneco.2017.08.006]]]
- 5 D. Zhang, M. Shi, and X. Shi, "Oil indexation, market fundamentals, and natural gas prices: an investigation of the Asian premium in natural gas trade," Energy Economics, vol. 69, pp. 33-41, 2018. https://doi.org/10.1016/j.eneco.2017.11.001doi:[[[10.1016/j.eneco.2017.11.001]]]
- 6 S. P . A. Brown and M. K. Yttcel, "What drives natural gas prices?," The Energy Journal, vol. 29, no. 2, pp. 45-60, 2008. https://doi.org/10.5547/ISSN0195-6574-EJ-V ol29-No2-3doi:[[[10.5547/ISSN0195-6574-EJ-Vol29-No2-3]]]
- 7 J. B. Geng, Q. Ji, and Y . Fan, "The behaviour mechanism analysis of regional natural gas prices: a multi-scale perspective," Energy, vol. 101, pp. 266-277, 2016. https://doi.org/10.1016/j.energy.2016.02.045doi:[[[10.1016/j.energy.2016.02.045]]]
- 8 Y . Shen, X. Sun, Q. Ji, and D. Zhang, "Climate events matter in the global natural gas market," Energy Economics, vol. 125, article no. 106887, 2023. https://doi.org/10.1016/j.eneco.2023.106887doi:[[[10.1016/j.eneco.2023.106887]]]
- 9 T. Wang, D. Zhang, Q. Ji, and X. Shi, "Market reforms and determinants of import natural gas prices in China," Energy, vol. 196, article no. 117105, 2020. https://doi.org/10.1016/j.energy.2020.117105doi:[[[10.1016/j.energy.2020.117105]]]
- 10 T. Wang, W. Qu, D. Zhang, Q. Ji, and F. Wu, "Time-varying determinants of China's liquefied natural gas import price: a dynamic model averaging approach," Energy, vol. 259, article no. 125013, 2022. https://doi.org/10.1016/j.energy.2022.125013doi:[[[10.1016/j.energy.2022.125013]]]
- 11 Y . J. Zhang, J. Chevallier, and K. Guesmi, ""De-financialization" of commodities? Evidence from stock, crude oil and natural gas markets," Energy Economics, vol. 68, pp. 228-239, 2017. https://doi.org/10.1016/j.eneco.2017.09.024doi:[[[10.1016/j.eneco.2017.09.024]]]
- 12 T. Wang, D. Zhang, and D. C. Broadstock, "Financialization, fundamentals, and the time-varying determinants of US natural gas prices," Energy Economics, vol. 80, pp. 707-719, 2019. https://doi.org/10.1016/j.eneco.2019.01.026doi:[[[10.1016/j.eneco.2019.01.026]]]
- 13 Y . Li, J. Chevallier, Y . Wei, and J. Li, "Identifying price bubbles in the US, European and Asian natural gas market: evidence from a GSADF test approach," Energy Economics, vol. 87, article no. 104740, 2020. https://doi.org/10.1016/j.eneco.2020.104740doi:[[[10.1016/j.eneco.2020.104740]]]
- 14 D. Ferrari, F. Ravazzolo, and J. V espignani, "Forecasting energy commodity prices: a large global dataset sparse approach," Energy Economics, vol. 98, article no. 105268, 2021. https://doi.org/10.1016/j.eneco.2021.105268doi:[[[10.1016/j.eneco.2021.105268]]]
- 15 F. Li, X. Li, H. Zheng, F. Yang, and R. Dang, "How alternative energy competition shocks natural gas development in China: a novel time series analysis approach," Resources Policy, vol. 74, article no. 102409, 2021. https://doi.org/10.1016/j.eneco.2021.105268doi:[[[10.1016/j.eneco.2021.105268]]]
- 16 X. Shi and Y . Shen, "Macroeconomic uncertainty and natural gas prices: revisiting the Asian Premium," Energy Economics, vol. 94, article no. 105081, 2021. https://doi.org/10.1016/j.eneco.2020.105081doi:[[[10.1016/j.eneco.2020.105081]]]
- 17 G. Choi and E. Heo, "Estimating the price premium of LNG in Korea and Japan: the price formula approach," Energy Policy, vol. 109, pp. 676-684, 2017. https://doi.org/10.1016/j.enpol.2017.07.033doi:[[[10.1016/j.enpol.2017.07.033]]]
- 18 C. W. Su, M. Qin, H. L. Chang, and A. M. Țaran, "Which risks drive European natural gas bubbles? Novel evidence from geopolitics and climate," Resources Policy, vol. 81, article no. 103381, 2023. https://doi.org/10.1016/j.resourpol.2023.103381doi:[[[10.1016/j.resourpol.2023.103381]]]
- 19 BP, "BP statistical review of world energy 2022: natural gas," 2022 (Online). Available: https://www.bp.com/content/dam/bp/business-sites/en/global/corporate/pdfs/energy-economics/statisticalreview/bp-stats-review-2022-full-report.pdf.custom:[[[https://www.bp.com/content/dam/bp/business-sites/en/global/corporate/pdfs/energy-economics/statisticalreview/bp-stats-review-2022-full-report.pdf]]]
- 20 D. Korobilis, "Assessing the transmission of monetary policy using time‐varying parameter dynamic factor models," Oxford Bulletin of Economics and Statistics, vol. 75, no. 2, pp. 157-179, 2013. https://doi.org/10.1111/j.1468-0084.2011.00687.xdoi:[[[10.1111/j.1468-0084.2011.00687.x]]]
- 21 K. Yang, Y . Guo, and F. Tian, "Cross-market contagion of global systemic financial risk under the impact of economic policy uncertainty: research based on TVP-FA V AR and TVP-V AR models," Statistical Research, vol. 40, no. 7, pp. 70-84, 2023. https://doi.org/10.19343/j.cnki.11-1302/c.2023.07.006doi:[[[10.19343/j.cnki.11-1302/c.2023.07.006]]]
- 22 J. Chai, X. Zhang, H. Shi, and Y . Wang, "Dynamic characteristics and transmission mechanism of China's natural gas security situation," Xitong Gongcheng Lilun yu Shijian/System Engineering Theory and Practice, vol. 42, no. 3, pp. 701-712, 2022. https://doi.org/10.12011/SETP2020-3065doi:[[[10.12011/SETP-3065]]]
- 23 L. Kilian, "Not all oil price shocks are alike: disentangling demand and supply shocks in the crude oil market," American Economic Review, vol. 99, no. 3, pp. 1053-1069, 2009. https://doi.org/10.1257/aer.99.3.1053doi:[[[10.1257/aer.99.3.1053]]]
- 24 B. S. Bernanke, J. Boivin, and P . Eliasz, "Measuring the effects of monetary policy: a factor-augmented vector autoregressive (FA V AR) approach," The Quarterly Journal of Economics, vol. 120, no. 1, pp. 387-422, 2005. https://doi.org/10.1162/0033553053327452doi:[[[10.1162/0033553053327452]]]
- 25 G. E. Primiceri, "varying structural vector autoregressions and monetary policy," The Review of Economic Studies, vol. 72, no. 3, pp. 821-852, 2005. https://doi.org/10.1111/j.1467-937X.2005.00353.xdoi:[[[10.1111/j.1467-937X.2005.00353.x]]]
- 26 J. Nakajima, "Time-varying parameter V AR model with stochastic volatility: an overview of methodology and empirical applications," Monetary and Economic Studies, vol. 29, pp. 107-142, 2011.custom:[[[https://econpapers.repec.org/article/imeimemes/v_3a29_3ay_3a2011_3ap_3a107-142.htm]]]
- 27 Y . Feng, D. Xu, P . Failler, and T. Li, "Research on the time-varying impact of economic policy uncertainty on crude oil price fluctuation," Sustainability, vol. 12, no. 16, article no. 6523, 2020. https://doi.org/10.3390/su12166523doi:[[[10.3390/su1523]]]
- 28 T. Wang, F. Wu, D. Zhang, and Q. Ji, "Energy market reforms in China and the time-varying connectedness of domestic and international markets," Energy Economics, vol. 117, article no. 106495, 2023. https://doi.org/10.1016/j.eneco.2022.106495doi:[[[10.1016/j.eneco.2022.106495]]]
- 29 National Development and Reform Commission, "14th five-year plan for renewable energy development," 2022 (Online). Available: https://www.ndrc.gov.cn/xwdt/tzgg/202206/P020220602315650388122.pdf.custom:[[[https://www.ndrc.gov.cn/xwdt/tzgg/202206/P020220602315650388122.pdf]]]
- 30 Y . Chen, C. Wang, and Z. Zhu, "Toward the integration of European gas futures market under COVID-19 shock: a quantile connectedness approach," Energy Economics, vol. 114, article no. 106288, 2022. https://doi.org/10.1016/j.eneco.2022.106288doi:[[[10.1016/j.eneco.2022.106288]]]