Doyeon Hyeon , Chaeyeong Lee , Heemin Kim , Sungrae Cho , Jeongyeup Paek and Ramesh Govindan
Probabilistic Resource Rescheduling for C-V2X based on Delivery Rate Estimation
Abstract: Vehicle-to-everything (V2X) communication is an essential component for fully autonomous vehicles in future intelligent transportation systems, and cellular-V2X (C-V2X) is a standard that allows vehicles to communicate with its surroundings using cellular technology. Among the resource allocation modes of C-V2X, Mode 4 is a distributed scheme in which each vehicle independently selects a radio resource using the sensing-based semi-persistent scheduling (SB-SPS) algorithm. However, it is susceptible to resource conflicts especially with increased vehicle density or mobility, and the conflicts cannot be detected, leading to poor performance due to collisions and interference. To address this problem, this paper proposes a delivery rate estimation based probabilistic resource re-scheduling (EB-PRS) scheme. The delivery ratio is estimated using opportunistic bloom filter-based feedback on which vehicle’s messages are received successfully. Based on the estimated delivery rate, EB-PRS carefully reselects resources probabilistically to maximize performance. EB-PRS is evaluated in highway and urban scenarios using WiLabV2Xsim simulator to show that it significantly improves upon the SB-SPS by reducing packet collisions.
Keywords: Cellular-V2X (C-V2X) , Mode 4 , SB-SPS , vehicle-to-everything communication (V2X) , vehicular network
I. INTRODUCTION
RAPID advances in sensing, communication, and computing technologies have enabled the vision of connected and autonomous vehicles. Future vehicles will become more intelligent and capable of fully autonomous driving to enhance transportation safety, user experience, as well as traffic efficiency dramatically [1], [2]. However, reliable connectivity in vehicular networks is a fundamental premise for such a vision, where dynamic density and frequent topology changes due to mobility often cause communication failures [3]-[7].
Vehicle-to-everything (V2X) is a communication technology that connects vehicles, roadside infrastructure, and potentially bicycles and pedestrians for intelligent transport systems and autonomous vehicles [8]. V2X communication is the basis for advancements in identifying situations outside the range of cameras or lidar sensors, or sharing information with its surroundings to alleviate traffic congestion. Accordingly, the 3rd generation partnership project (3GPP) introduced the cellular V2X (C-V2X, a.k.a. LTE-V2X) standards in Release 14 with the advantage of being able to use existing cellular technology [9]. C-V2X supports communication with V2X app servers or the Internet via the Uu interface and supports vehicle-to-vehicle (V2V) communication through the PC5 interface also known as the sidelink communication [10].
In sidelink communication, a vehicle communicates directly with another on a wireless resource (i.e., a channel in time/frequency domain), and 3GPP Release 14 supports two modes of operation (3 and 4) for resource selection. In Mode 3, the cellular base station selects wireless resources for V2V communication [11], [12], while in Mode 4, each vehicle autonomously selects a wireless resource for itself using the sensing-based semi-persistent scheduling (SB-SPS) algorithm. Since Mode 3 selects resources in a centralized way, it is possible to have more global view of the network and minimize resource collisions by maximizing the distances between vehicles that are allocated the same resources. However, Mode 3 is possible only within cellular coverage, requires communication overhead for resource allocation, and the computation cost increases with the number of vehicles. On the other hand, Mode 4 is lightweight and can be used regardless of cellular coverage. However, it is susceptible to resource conflicts and is oblivious of collisions since it selects resources in a distributed manner based on signal strength sensing without any feedback. In particular, as the traffic density or mobility increases, the resource conflict rate tends to increase, and the conflicts cannot be detected, leading to poor performance.
Various studies have been conducted to improve the packet delivery ratio of C-V2X Mode 4 by changing its resource selection method (related work in Section III). A few prior works inform nearby vehicles of the next resource to be used so that different resources can be selected for each vehicle, and other studies aims to maximize the distances between vehicles that select the same resources. However, when the vehicle density is high, several vehicles may often have no choice but to use duplicate/conflicting resources. For this reason, some works control the transmission power and interval in situations where the resources are insufficient compared to the vehicle density and transmission rate.
Despite previous attempts to carefully select resources that are less likely to be used by other vehicles, collisions may still occur. And because C-V2X radios operate in half duplex mode [13], vehicles transmitting packets on the same resource cannot detect each other’s presence. Furthermore, the SBSPS algorithm of C-V2X Mode 4 uses the selected resource repeatedly for an average of 1 second [14] and possibly longer with reselection probability [TeX:] $$P_k$$ (background in Section II). Thus, even if the vehicles collide on a same resource, they continue to use the same conflicting resource repeatedly without knowing each other’s existence, resulting in poor communication performance.
To address this problem, this paper proposes a delivery rate estimation based probabilistic resource re-scheduling scheme (EB-PRS). In EB-PRS, each vehicle opportunistically sends a bloom filter-based feedback on whether packets from other vehicles have been received successfully, where a bloom filter is used to compactly represent vehicle identities (e.g., MAC addresses) for low overhead. The vehicle receiving the feedback messages can estimate its delivery ratio by identifying whether its own packets have been successfully delivered to the senders of the feedback. A low packet delivery ratio means that there is a problem with the resource selected by the vehicle, and repeated collisions can be stopped by inducing the vehicle to select another resource. Finally, the packet delivery ratio is improved by determining an appropriate resource reselection probability through a heuristic according to the predicted packet delivery ratio.
This work has two contributions;
· We propose EB-PRS that estimates the packet delivery ratio using bloom filter-based feedback and improves the packet delivery ratio by probabilistically reselecting resources.
· Simulations in various scenarios show that EB-PRS has superior performance compared to the standard C-V2X Mode 4 and other comparative prior works.
The remainder of this paper is organized as follows. Section II provides a brief background of C-V2X Mode 4, and related prior studies are introduced in Section III. Section IV presents the design of EB-PRS, and Section V evaluates the performance of the proposed technique. Finally, Section VI concludes the study.
II. BACKGROUND
C-V2X [9] uses single-carrier frequency-division multiple access (SC-FDMA) in the 5.9 GHz band, and supports 10 MHz or 20 MHz bandwidth. Channels are divided into time (subframe)-frequency (subchannel) pairs, and each vehicle selects one or more channels for transmission. A subframe is the unit of message scheduling, which equals a frame transmission time of 1 ms. A subchannel is composed of a set of contiguous resource blocks (RBs), where an RB is defined as 1 slot (0.5 ms) in time and 12 consecutive subcarriers ([TeX:] $$12 \times 15$$ kHz = 180 kHz) in the frequency domain. The number of RBs per subchannel may vary depending on the modulation and coding scheme (MCS) level and the length of the packet to be transmitted.
Meanwhile, the European Telecommunications Standards Institute (ETSI) defines the cooperative awareness message (CAM). Each vehicle puts its own information (e.g., identification, status, location, speed, etc.) in the CAM, and broadcasts it periodically, forming the basis for several road safety and traffic efficiency applications [15]. To transmit such a data message in C-V2X Mode 4, it needs to be included in a transport block (TB) sent through a physical sidelink shared channel (PSCCH), and sidelink control information (SCI) is transmitted together using two RBs through a physical sidelink control channel (PSSCH) in the same subframe. This SCI contains various information used for TB transmission such as the MCS level. Among them, the resource reservation interval (RRI) [14] indicates that the transmitting vehicle has reserved the resource and intends to reuse the same subchannel after RRI time. For example, RRI is 100 ms when the vehicle transmits packets at 10 packets per second (pps) [14]. Thus, upon reception of messages from neighboring vehicles, RRI in SCI can be used to predict the resources used by other vehicles for their transmissions. For example, the SB-SPS algorithm uses RRI to exclude the reserved resources from the reselection candidate resources.
We use Fig. 1 to briefly overview the SB-SPS algorithm. In C-V2X Mode 4, each vehicle selects its radio resources independently in a distributed manner based on signal strength sensing. When there is data to be transmitted at time T and no resource is reserved yet at the MAC layer, the vehicle selects a new resource for its transmissions. To avoid selecting the resources used by other vehicles to the extent possible, the vehicle continuously measures the sidelink received signal strength indication (S-RSSI) during a sensing window (usually set to 1,000 ms) before its selection. Then, a selection window is set to the maximum allowable transmission latency, which equals the time interval between periodic transmissions. For example, this latency is 100 ms, 50 ms, and 20 ms, respectively, when the vehicle transmits packets at 10 pps, 20 pps, and 50 pps [14], [16].
Fig. 1.
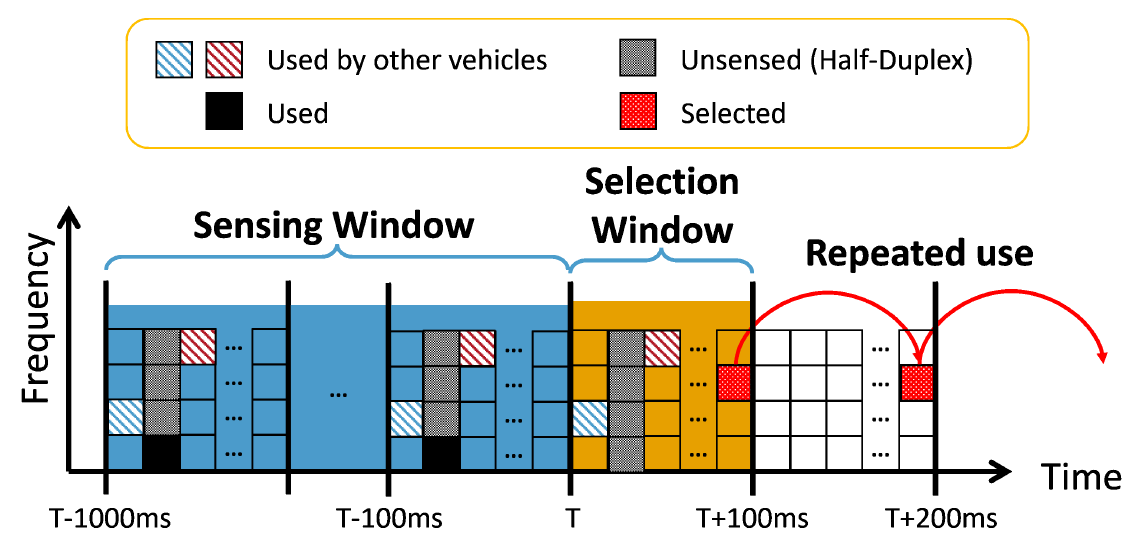
Among the available resources in the selection window (based on its size), the vehicle creates a candidate singlesubframe resources (CSR) list. From this CSR, the resources occupied by other vehicles (known from RRI) and the resources whose average S-RSSI values measured during the sensing window is higher than the S-RSSI threshold are excluded. Furthermore, all resources in the same subframe as those used by the vehicle itself during the sensing window are also excluded from the CSR (see Fig. 1). This is because S-RSSI on those subframes cannot be detected due to half- duplex radio, and thus it is not possible to know whether the corresponding resources are being used by other vehicles. Now, if the size of CSR is less than 20% of the total number of resources, the algorithm increases the S-RSSI threshold by 3 dB and repeats the above process. Otherwise, when the number of CSR is greater than 20% of the total, top 20% of the resources with the lowest S-RSSI among CSR are extracted as the final selection candidates.
Finally, the resource to be used is selected randomly among those candidates. The selected resource is reused a random number of times called the reselection counter (RC). The size of the RC depends on the RRI. RC is randomly selected from the range [5,15] when RRI is 100 ms or more, [10,30] when RRI is 50 ms, and [25,75] when RRI is 20 ms [17]. Whenever a resource is used for data transmission, RC is decremented by 1. When RC reaches 0, it is decided whether to keep the same resource with probability [TeX:] $$P_k$$ or select a new resource with probability [TeX:] $$1-P_k$$ where [TeX:] $$P_k$$ can range from 0 to 0.8 in the standard.
Since each vehicle selects its radio resources independently in a distributed manner based on signal strength sensing, each vehicle is oblivious of exactly which resource a neighboring vehicle has selected until a message has been correctly received from that vehicle on the resource. For this reason, there is a possibility that two or more vehicles choose the same resource and repeatedly collide, without successful reception, which may cause serious performance problems. This is the problem that we address in this work.
III. RELATED WORK
Several prior studies propose enhancements for improving the packet delivery performance of C-V2X Mode 4. These can be categorized into three approaches, (1) resource selection methods to minimize conflicting vehicles, (2) transmit power and/or rate control, and (3) collision detection-based avoidance.
A. Collision Avoidance via Resource (Re)selection
The most popular approach for collision avoidance in CV2X Mode 4 is to aim to select different resources for each vehicle to the extent possible. Jeon et al. [18], [19] execute the resource reselection process on average 1 second earlier than the Mode 4. By repeatedly transmitting the time-frequency information of the reserved resource, they show that the uncertainty of resource usage and the probability of collision can be greatly reduced. The short-term sensing-based resource selection (STS-RS) [20] scheme selects the next resource based on the short sensing result just before the resource reselection, unlike Mode 4 which senses for a relatively long period (e.g., 1 second). The authors show that this is effective in improving the packet reception ratio (PRR) even for nonperiodic traffic. The estimation and reservation resource allocation (ERRA) [21] scheme notifies neighbors with same RC of their estimated resource location so that they can be monitored and reused. However, a collision occurs when a vehicle that does not receive the reservation information appears within the vehicle’s broadcast range and uses the reserved resource. To solve this problem, Sabeeh et al. [22] proposed the extended- ERRA (E-ERRA) scheme that prespecifies a list of alternative resources.
From a slightly different perspective, geo-based scheduling [23] infers the geographical order of locations of vehicles by exchanging indices within a traffic lane, and resources are allocated according to this order to maximize the resource reuse distances. He et al. [24] show that collisions are greatly reduced by transmitting control and data packets in different subframes so that neighboring vehicles can better exchange reservation information about each other at the cost of using additional resources. Finally, Bartoletti et al. [16] provide an analysis of how non-ideal periodicity of packet generation affects the performance of C-V2X Mode 4 and discuss insights into how to design the parameter settings to improve the performance.
B. Collision Avoidance via Transmit Power/Rate Control
Resource conflict problem worsens as density increases. There may be cases where the number of vehicles exceed the number of resources and thus the same resource has to be used by multiple vehicles. Therefore, there are prior studies that attempt to reduce the effective vehicle density by adjusting the transmission power, or manage the resource pool by adjusting the transmission rate according to the surrounding conditions. ATOMIC [3] estimates collision probability using the distances to neighboring vehicles extracted from the CAM, and adjusts the transmission rate to improve effective throughput. Thereafter, the transmission power is adjusted so that the PRR is maximized in consideration of the range to adjacent vehicles. Yoon et al. [25] adopted SAE J2945/1 [26] into CV2X, a congestion control standard for short-range vehicular communication, but modified (relaxed) the rate of transmission rate control so that the adjustment of transmit power can better contribute to mitigating the congestion problem. SPS++ algorithm [27] dynamically adjusts the RRI according to the surrounding vehicle density to improve the resource usage efficiency while solving the collision problem of fixed RRI. Kang et al. [28] investigated the effect of transmission power on PRR according to vehicle density, and improved the Mode 4 algorithm in terms of PRR by adjusting the transmit power based on observed S-RSSI levels.
C. Collision Avoidance via Detection
Since packet collisions cannot be detected during transmission on half-duplex wireless radios, another line of research focuses on methods for detecting and stopping collisions using feedback mechanisms.
· ACK-Feedback [29] scheme provides feedback using a bitmap in which a bit at the position corresponding to a resource is set to 1 when a packet is successfully received on that resource. The transmitter checks whether the bit of the resource used for its transmissions is set to 1 (ACK) in the feedback received from its neighbors. If the ACK ratio is less than 60%, resource is reselected. It is based on an intuition that, if multiple transmitters are using a same conflicting resource, majority of those packets will not be received correctly. Nevertheless, the accuracy of feedback is limited becasue it does not explicitly tell who sent the packet using the resource. Even if the ACK ratio is high on some receiver, the bit may still be set to 1 by another vehicle that has transmitted a packet with the same resource, and the conflict may persist on other receivers.
· Collision-Feedback [30] scheme uses SINR, RSSI, and inband emission (IBE) observations to determine whether a collision occured on a resource, and this information is provided as feedback. Whenever a feedback is received, the vehicle that uses the conflicting resource for its transmissions selects a new resource using the standard SB-SPS algorithm. Assuming that there are sufficient number of alternate vacant resources, i.e., assuming that two conflicting vehicles are likely to select different vacant resources in their reselection, successive collisions can be resolved within two packets. However, frequent resource reselection may worsen performance because the resource usage of other vehicles cannot be inferred (from RRI) nor predicted (from S-RSSI).
Based on the shortcomings of existing studies, we find that it is important to improve the accuracy of feedback, and the frequency of resource reselection should be managed carefully to maintain predictability and efficiency. We address these challenges in the following proposal.
IV. DESIGN OF EB-PRS
If a vehicle knows that its packets are not being delivered well, then it may be possible to improve the situation by changing the resource it is using. This section presents the design of EB-PRS, a method to resolve resource conflicts and improve packet delivery performance by reselecting resources based on the estimated delivery ratio inferred using lightweight feedback.
A. Feedback-based Collision Detection
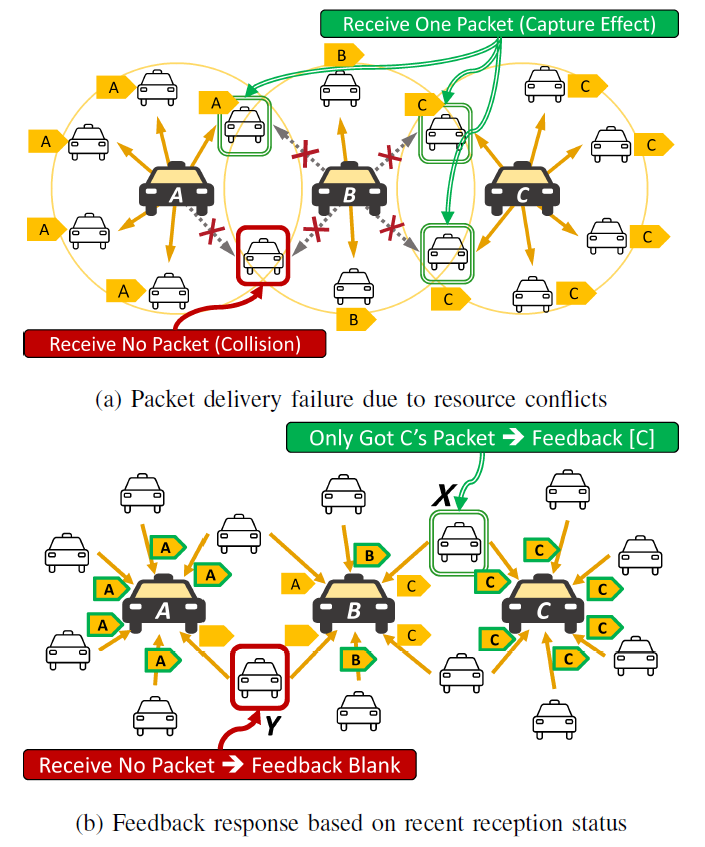
Fig. 2(a) is an example to illustrate the proposed feedback based collision detection scheme on how to infer the packet delivery ratio. Vehicles A, B, and C simultaneously transmit their packets using an identical channel resource, resulting in resource conflict and packet collision. A solid yellow arrow means that a packet has been received successfully, and a dotted arrow marked with X means the packet failed to be delivered. Some vehicles do not receive a packet due to collision because multiple transmitters use the same conflicting resource. For example, the vehicle marked in red line box does not receive any packets. A vehicle may receive one of the collided packets from a (likely the nearest) vehicle due to the capture effect, such as those marked in green double line box. Therefore, A succeeds in delivering its packet to a total of five neighboring vehicles, B to two neighboring vehicles, and C to six neighboring vehicles.
Fig. 2(b) illustrates the feedback information that will be returned to the transmitter (vehicles A, B, and C). Note that this feedback can opportunistically be embedded and piggybacked in regular periodic data transmissions of the vehicles such as the CAM, so there is no distinction between data transmission and feedback; a CAM can serve for both purposes. When A, B, and C’s neighbor vehicles successfully receive a packet, they identify and record the source address of the packet. According to 3GPP TS 24.386 [31] IP-based V2X communication over PC5, V2X messages use source and destination ID in layer 2, so, without loss of generality, the address can regarded as a MAC address (6 bytes) or equivalent. Then, when it is the vehicles’ turn to transmit a packet, the collected source addresses are marked in the packet as feedback. For example, since vehicle X (marked in green double line box) received only C’s packet, C’s address will be in the feedback, and since vehicle Y (marked in red line box) has not received any packet, its feedback will contain no address information.
After transmission, the delivery ratio p can be estimated simply by dividing the number of feedback with its own address (a) by the number of packets received from its neighbors (N) as,
For example, vehicle A in Fig. 2(b) receives six packets (N = 6) from its neighbors, and five of these neighbors indicate that they have received packets from A. Thus, estimated delivery ratio p for vehicles A, B, and C are 5/6 = 83%, 2/6 = 33%, and 6/6 = 100%, respectively. The numbers reflect the fact that vehicle B had the most trouble in delivering its broadcast because it had the most resource conflicts with surrounding vehicles A and C. In this case, if vehicle B can promptly change the resource it uses, the overall packet delivery performance can be improved. Conversely, vehicles with high p (i.e., A & C) should continue to use their current resource for stability and predictability; reselection would only add uncertainty with little or negative gains.
B. Feedback Compression Using Bloom Filter
The simplest way to represent a list of collected source IDs in a feedback is to concatenate them. However, this would result in a large message overhead (e.g., 6 bytes per MAC address), large redundancy (e.g., first three bytes of a MAC address may be unnecessary), and moreover, a variable and unbounded size feedback. For example, if there are 50 neighboring vehicles from which a message was received, a feedback of 300 bytes would be required. Considering that 3GPP TR 36.885 [32] considers a CAM packet length of 190 or 300 bytes, this is a significant (and potentially infeasible) overhead. Therefore, EB-PRS uses a bloom filter as a method to compress this overhead.
Bloom filter is a space-efficient data structure used to test whether an element is a member of a set [33]. The process of adding an element to a bloom filter of length L is as follows.
1) First, a bit array of length L is initialized to all zeros.
2) For each element to be added, K hash values of an element is calculated via K hash functions, where the range of a hash value is within [0, L].
3) Then, the bit corresponding to each hash value is set to 1 in the bit array of length L. This is repeated for all elements to be added.
An element is a member of the bloom filter if all K bits corresponding to the hash values of the element are 1. The bloom filter has a length of L regardless of the number of elements added.
In EB-PRS, the collected source addresses of recently received messages are the elements to be added to the bloom filter and sent as feedback. The vehicle receiving the feedback checks if its own address is a member of the set recorded in the bloom filter to verify whether its packet has been delivered successfully to the sender of the feedback. Fig. 3 is an example, where a bloom filter with K = 2 and L = 20 bits is used. Vehicle X has successfully received packets from vehicles A and B, but not from C nor D, and should inform them via feedback. So, vehicle X enters the addresses of A and B into K hash functions to get the hash values and set the bits at those locations to 1. The K hash functions temporarily used in Fig. 3 are at the top right of the figure. Therefore, since the hash values of address A are 3 and 5, respectively, and the hash values of address B are 5 and 15, respectively, X sets the 3rd, 5th, and 15th bits to 1 to generate feedback. Vehicle X transmits a packet with the feedback, and other vehicles (X’s neighbors) receive this and check the feedback. Since all hash values corresponding to bits of A’s address are in X’s feedback, A knows that X has successfully received its packet. Conversely, not all bits corresponding to C’s address are in X’s feedback. Thus, C knows that X did not receive C’s packet.
Fig. 3.
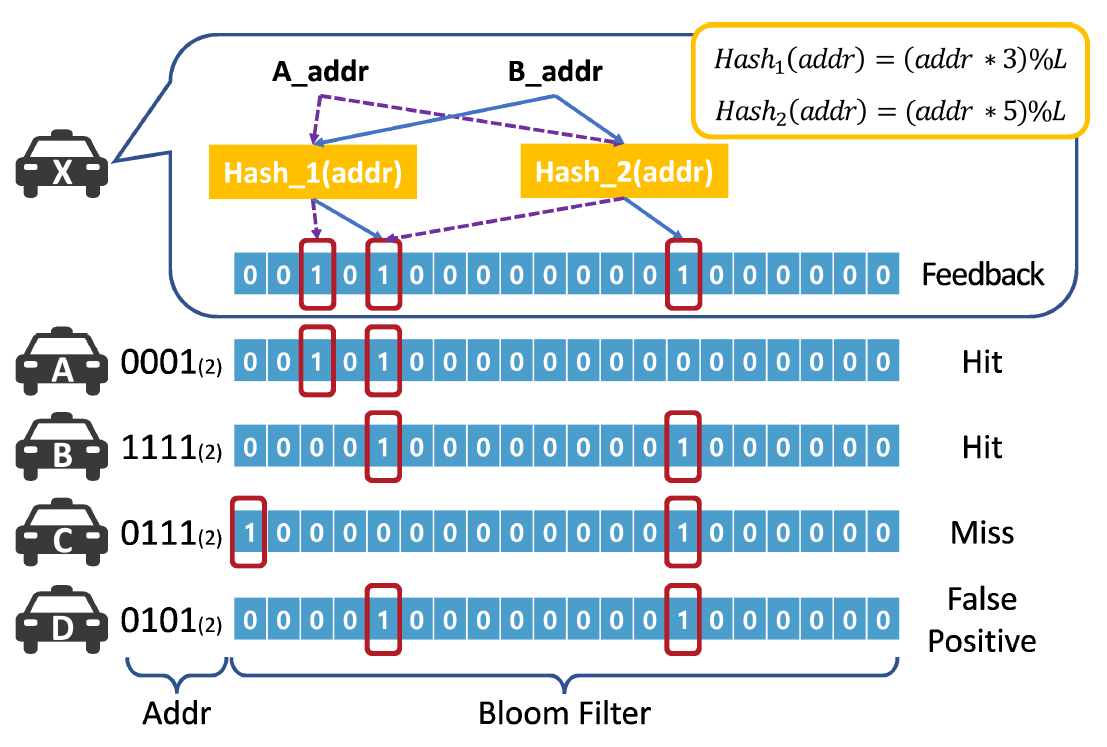
However, in the same example, even though X has not received D’s packet, D’s hash values match those in the feedback, resulting in a false positive. Due to false positives, D may think that its packet has been delivered successfully, and delivery ratio may be estimated higher than the actual. Therefore, it is necessary to select an appropriate L and K that has low overhead while taking into account an acceptable false positive rate, which we discuss in Section V.E.
C. Resource Reselection Probability
It would be better to reselect the channel resource if there is something wrong (i.e., low packet delivery ratio) with the currently selected resource. On the other hand, frequent reselection should be refrained if anticipated gain is small to none. The challenge is to determine when and how often to perform reselection. For this purpose, EB-PRS uses a simple heuristic scheme that reselects resources probabilistically based on the estimated delivery ratio p.
When p approaches 1, it means that the packets are being delivered well, and thus the resource reselection probability q should be set to 0 to prevent unnecessary resource change. Conversely, when p approaches 0, it means that the packets are not being delivered well, and thus the resource reselection probability q should be close to 1 so that the resource can be altered. Then, a simple relationship between p and the resource reselection probability q can be expressed in the form of,
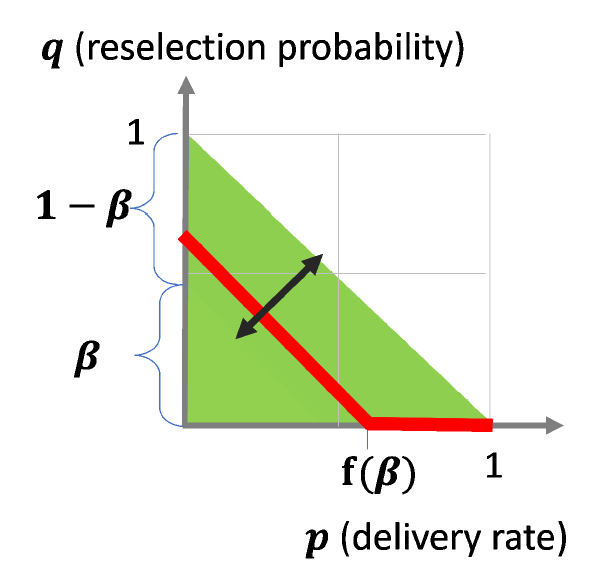
However, unnecessary or frequent reselection should be avoided if anticipated gain is small to none; it would only add uncertainty. Furthermore, p can be lower than 1 for reasons other than resource conflict. For example, a vehicle sending the feedback may have previously been far away and did not receive the packet even though there was no collision. In these cases, it may be advantageous to maintain the current resource usage rather than select a new one even if p is slightly less than 1. Based on this intuition, we shift (2) by [TeX:] $$f(\beta)$$ to design our reselection probability function q as,
which has a y-intercept of [TeX:] $$f(\beta)$$ and a slope of -1, bounded between [0, 1], where [TeX:] $$f(\beta)$$ is defined as,
When p is higher than [TeX:] $$f(\beta)$$, resource is not reselected. On the other hand, β is the lower bound of the reselection probability; i.e., when p reaches 0, the resource is reselected with a probability of at least β. β is a configurable parameter similar to the Pk of SB-SPS, and we empirically use 50% to balance stability and agility. The (1 - β) term is used to reflect the ratio of available resources. When the overall resource pool decreases, competition for a resource among vehicles increases. If the competition for the resources to be newly selected is higher than that of the resources currently in use, then it is advantageous not to select a new resource. r is the current resource pool size, calculated as the number of subchannels multiplied by the current transmission interval (e.g., 50 ms for 20 pps). N is the number of packets received within one transmission interval, and R is the maximum resource pool size, calculated as the number of subchannels multiplied by the maximum transmission interval of CAM (100 ms). Then, if N packets were received through N resources among r, r - N becomes the number of remaining available resources. For example, if the transmission period is 50 ms, number of subchannels is 2, and the number of received packets is 30, then R is [TeX:] $$100 \times 2 = 200$$, r is [TeX:] $$50 \times 2 =100$$, so the estimated available resource ratio becomes [TeX:] $$(100-30) \div 200=0.35$$. This term is used to adjust the reselection probability q.
Fig. 4.
D. Resource Selection Mechanism
In this section, when and how the p and q are calculated, and the process of triggering reselection using them is explained. In addition, a new resource selection algorithm is presented.
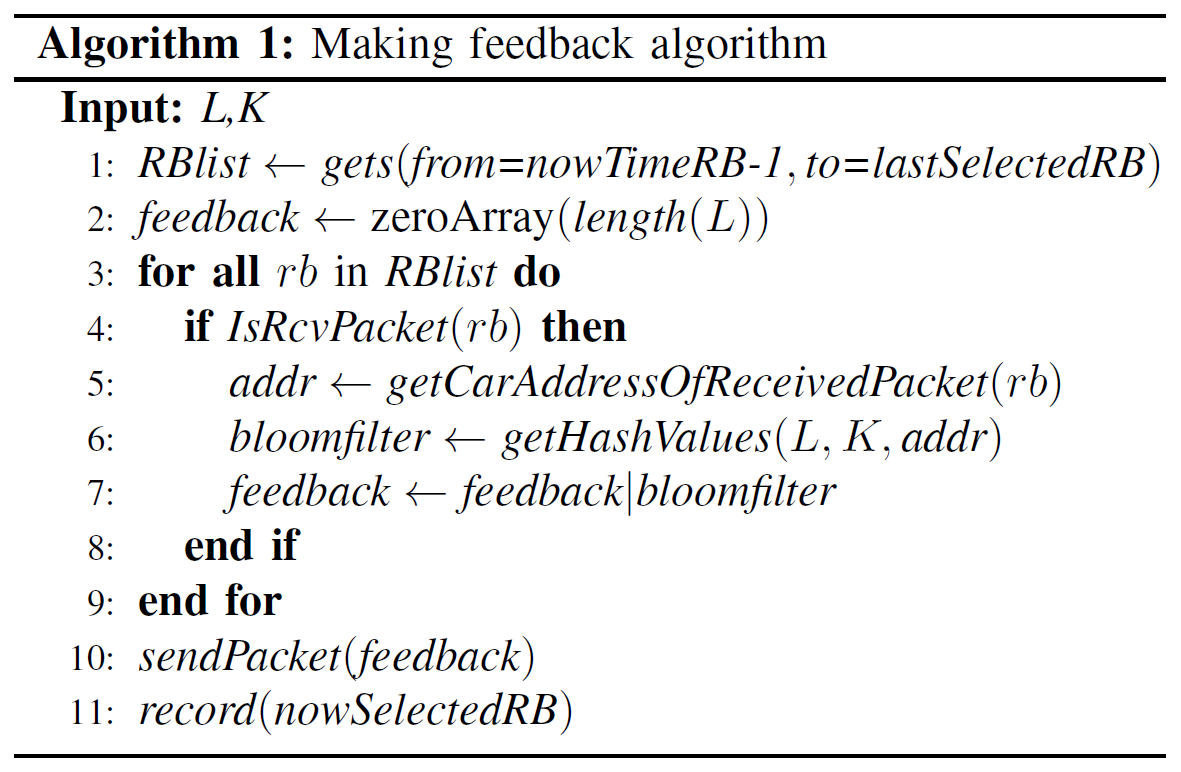
Algorithm 1 describes the process of generating feedback when sending packets. Basically, whenever each vehicle receives a packet through a specific resource at a specific time, it records the address of who sent it and the feedback in the message. And when it’s time to send the packet, feedback is generated to send (lines 1-7). RBlist is extracted to traverse all from the RB right before the current RB selected for transmission to the RB used in past packet transmission (line 1). The number of RBs in the RBlist may be greater than the size of the resource pool (r in (4)). This is because when the channel busy ratio (CBR) [34] increases, the packet generation interval can be much longer than the packet transmission interval due to distributed congestion control [35]. So, all feedback received since the last packet transmission is checked. If there is a packet received from each RB, the address of the vehicle that sent the packet is converted to bloomfilter using L and K as described in Section IV.B (lines 4-6). By OR operation, all bloomfilter is combined to one feedback (line 7). The generated feedback is transmitted and the RB information used in the current transmission is saved for feedback generation in the next transmission (lines 10-11).
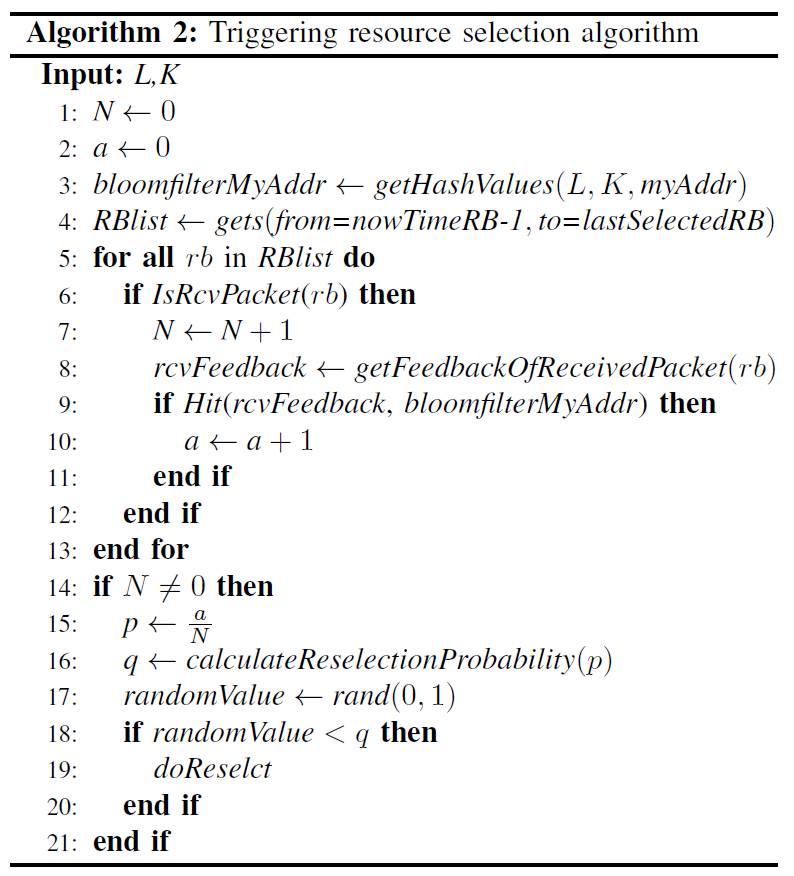
Algorithm 2 describes the process of collecting feedback information from others, calculating the delivery rate p and reselection probability q, and triggering reselection using them. If there is a packet to be transmitted, it is checked whether resource reselection should be triggered. To calculate the delivery rate p with (1), N and a are initialized to 0, a bloomfilter is created by calculating hash values for its own address (lines 1-3). N is incremented if there are packets received while traversing RBlist (lines 5-7). When bloomfilterMyAddr hits with the received feedback, a is increased by 1 (lines 8-11). If there is more than one received packet, p and q are calculated by (1) and (3) respectively (lines 14-16). If randomValue is lower than q, resource reselection is triggerd (lines 18-20).
Algorithm 3 is the pseudocode of selecting the next resource to be used. It is used by default when selecting a resource, and is also executed when reselection is triggered by Algorithm 2. The extracted RBlist may not be the same as the resource pool (r in (4)) because the transmission time and resource selection time do not coincide. Since a resource must be selected from the resource pool, the case where the size of RBlist is smaller than the resource pool is checked and changed (line 2). The rating is then calculated for the resource pool, not the RBlist (line 3). If the resource is reserved by another vehicle (known via RRI), after mapping the RB to the resource pool, the rating for that location is set to 0 (lines 4-9). For not reserved resource, the latest S-RSSI value sensed on that resource is stored as the rating (lines 10-14). For all resources, 20% of the candidates with the lowest rating value are extracted, and the resource to be finally used is randomly selected (lines 13-14).
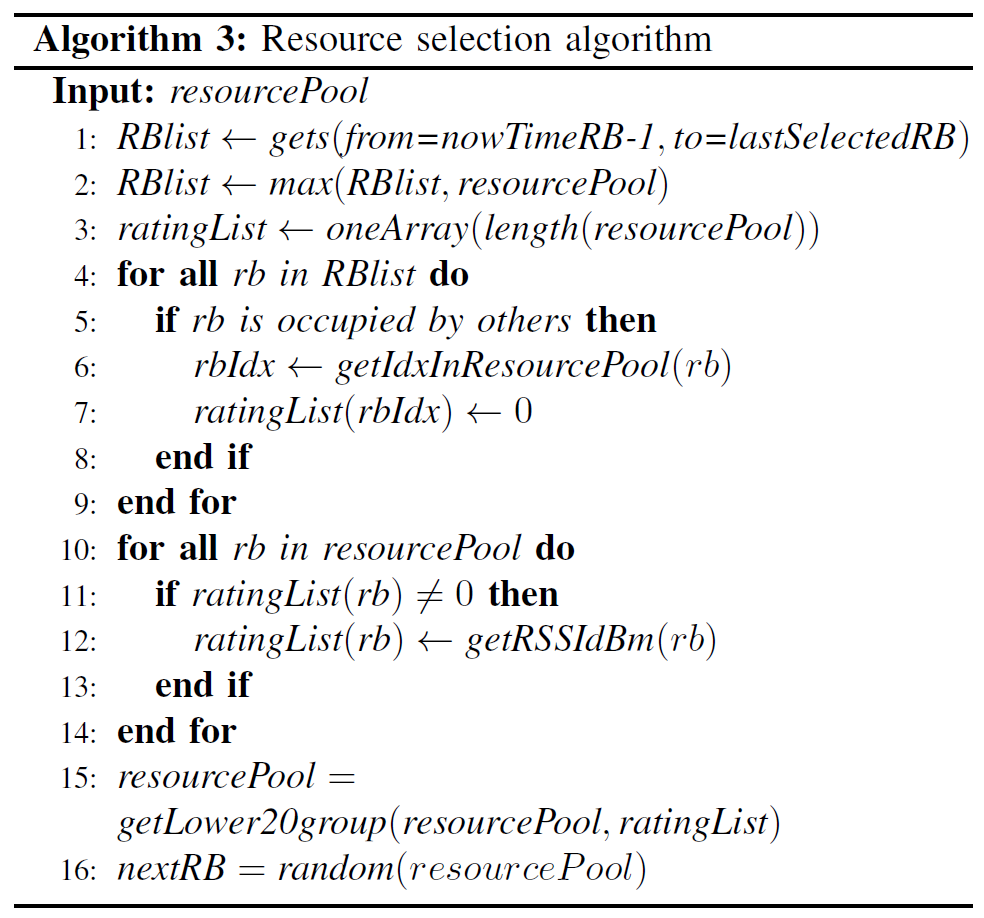
The intuition behind the design is as follows; As described earlier in Section II, the standard SB-SPS algorithm has a process of removing candidates from CSR based on RRI and S-RSSI. However, when vehicle density is high, the size of CSR may never exceed 20% of the total number of resources despite threshold adjustment, in which case no resource can be selected (This phenomenon occurs in the case of Collision-Feedback with 50 pps in Section V.A). To avoid this problem, EB-PRS considers all resources as candidates and calculate a rating for each resource similar to the ACK-Feedback scheme. Unlike ACK-Feedback which uses feedback for rating calculation, however, EB-PRS uses S-RSSI for the rating while the feedback is used only for reselection probability q. This approach addresses the problem of having insufficient candidates while taking into account the sensed signal strength level when reselection is most likely desirable based on the estimated delivery ratio and available resources.
V. EVALUATION
We evaluate EB-PRS by comparing it against the standard C-V2X Mode 4 as well as two state-of-the-art prior works, ACK-Feedback [29] and Collision-Feedback [30]. We also discuss the parameter selection for EB-PRS.
A. Simulation Settings and Test Scenarios
Simulations are performed using the WiLabV2Xsim [36] simulator, while the vehicle trajectory is generated using the SUMO [37] mobility simulator. Highway and urban scenarios are created according to 3GPP recommendation [32], and Fig. 5 depicts the shapes of the roads corresponding to each scenario as specified in Table I. The highway scenario (Fig. 5(a)) has a total road length of 2 km and 6 lanes (3 + 3) both ways. Each lane is 4 m wide and the vehicles have an average speed of 140 km/h. In the urban scenario (Fig. 5(b)), 433 m long and 250 m wide blocks are arranged in a 2x2 grid. Each road is 4 lanes both ways (2 + 2), and each lane is 3.5 m wide. Average speed of the vehicles is 60 km/h, and each vehicle performs straight, left, and right turns at the intersections with probability of 0.5, 0.25, and 0.25, respectively. Traffic density was set to 3 types; [50, 100, 200] vehicles-per-kilometer on the roads. When converted to area density, the urban scenario is measured to have a higher density than the highway scenario because there are intersections and lanes are narrower. We ran five simulations per each setup and scenario, and each run was for 60 seconds.
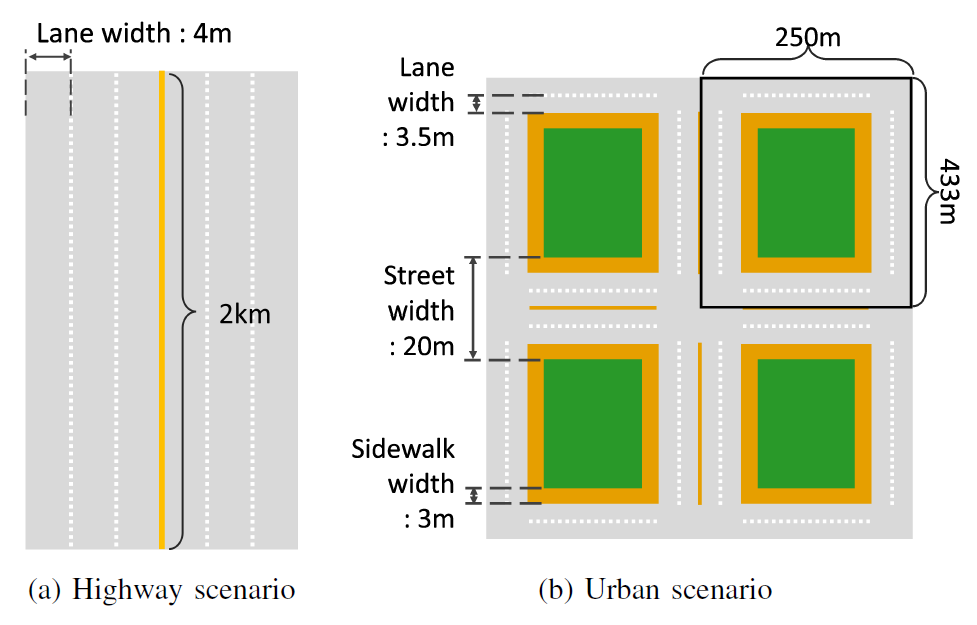
TABLE I
| Highway | Urban | |
|---|---|---|
| The number of lanes | 3+3 | 2+2 |
| Lane width (m) | 4 | 3.5 |
| Total road length (km) | 2 | 4.014 |
| Vehicle speed (km/h) | 140 | 60 |
| Density (veh/km) | 50, 100, 200 | |
| Density (veh/km2) | 2083, 4166, 8333 | 5357, 10714, 21428 |
Each vehicle transmits CAM packets at a rate of [10, 20, 50] pps. Default length of a packet is 190 bytes [32], and additional bits are added according to the tested algorithm. Table II presents the packet lengths used in our evaluation, including the additional bits. EB-PRS has a packet length of 220 bytes because it uses a 30 byte bloom filter for feedback as mentioned in Section V.E. ACK-Feedback adds bits according to the number of resources. Since the number of subchannels is 2, the number of resources is [200, 100, 40] for each [10, 20, 50] pps cases, resulting in [25,13,5] bytes added to the packet. Collision-Feedback does not add bits nor change the format of the existing C-V2X message. However, simulation of Collision-Feedback at 50 pps was not possible. As mentioned in Section III.C, Collision-Feedback uses the standard SBSPS algorithm as is when changing resources, where the entire subframe including the resources sensed during the sensing window are excluded from CSR. Collision-Feedback frequently undergoes resource reselection, which reduces the size of CSR. At high transmission rate, the size of the CSR becomes lower than 20%, which often leaves no resources for transmission. For this reason, there is no result for Collision- Feedback at 50 pps in later sections.
TABLE II
| 10 pps | 20 pps | 50 pps | |
|---|---|---|---|
| Mode 4 | 190 | 190 | 190 |
| EB-PRS | 220 | 220 | 220 |
| ACK-Feedback | 215 | 203 | 195 |
| Collision-Feedback | 190 | 190 | N/A |
In this work, transmit power is set to the maximum of 23 dBm, and MCS is unified to 7.1 For the reuse probability Pk, Collision-Feedback uses 0.8 [30] and ACK-Feedback uses 0 [29], the same values from their respective papers, and we use 0.8 for all other cases to compare the results. Other parameters used for the simulations are organized in Table III. To better understand the considered scenarios and channel loads, the average values of the measured CBR are reported in Table IV.
1 ACK-Feedback [29] used MCS 6 in their paper, but we determined that it is better to unify the configuration for fair comparison.
TABLE III
| Parameter | Used |
|---|---|
| Carrier frequency | 5.9 GHz |
| Bandwidth | 10 MHz |
| Propagation model | WINNER+, Scenario B1 |
| MCS level | 7 |
| The number of subchannels | 2 |
| Transmission power | 23 dBm |
| Transmitter/Receiver antenna gain | 3 dB / 3 dB |
| Noise figure | 6 dB |
| Shadowing variance | 3 dB (LOS), 4 dB (NLOS) |
| Minium SINR | 7.30 dB (MCS 7) |
| Threshold power level | -110 dBm |
| Packet size | 190 bytes (default) |
| Tranmission rate | 10 pps, 20 pps, 50 pps |
| Sensing period | 1 s |
| [TeX:] $$P_k$$ | 0.8 |
| β | 0.5 |
TABLE IV
| 10 pps | 20 pps | 50 pps | |
|---|---|---|---|
| Highway 50 veh/km | 0.16 | 0.32 | 0.56 |
| Highway 100 veh/km | 0.32 | 0.58 | 0.61 |
| Highway 200 veh/km | 0.58 | 0.71 | 0.71 |
| Urban 50 veh/km | 0.35 | 0.59 | 0.63 |
| Urban 100 veh/km | 0.67 | 0.72 | 0.75 |
| Urban 200 veh/km | 0.85 | 0.84 | 0.85 |
The evaluation metrics are as follows;
· PRR is calculated as, for each vehicle, the number of messages successfully received over the total number of packets transmitted by its neighbors.
· Effective CAM range is the distance between the transmitter and the receiver at which the PRR is guaranteed a minimum of 90% [3].
· Average throughput is the amount of data successfully delivered divided by the simulation time, excluding the overhead bits for feedback.
· Inter packet delay (IPD) is the time interval between two consecutive packets that are correctly received. [TeX:] $${IPD}_{90 \%}$$ is 90 percentile IPD.
B. Packet Reception Ratio and Effective CAM Range
Fig. 6 plots the PRR results for the four compared schemes when packets are sent at 10 pps in the highway scenario with 3 different traffic densities; [50, 100, 200] veh/km. Overall, higher traffic density tends to increase competition for limited resources, resulting in lower PRR. Nevertheless, EB-PRS has the best PRR than any other algorithm for all traffic densities except 50 veh/km. At 50 veh/km, Collision- Feedback is slightly better than EB-PRS. However, the CAM range is 307 m and 319 m, respectively, and the distance at which PRR satisfies 80% in the same scenario is 337 m and 345 m, showing that the performance gap between the two algorithms is gradually decreasing rather than widening. Additionally, both schemes have sufficiently good PRR and the difference is negligible ( < 2%) in this lowest density scenario, and it can be seen that the EB-PRS achieves the best PRR as the traffic density increases. This is because EBPRS detects collisions and changes resources upon detection, which becomes more effective in conflict-prone environments. In Figs. 6(b) and 6(c), ACK-Feedback had the second highest PRR performance after EB-PRS. ACK-Feedback also selects resource based on feedback, but performs less than EB-PRS because there is no precise feedback on who is using which resource. Collision-Feedback has a similar PRR to EB-PRS at 50 veh/km (Fig. 6(a)), but performs worse than the Mode 4 at 200 veh/km. This is because, as traffic density increases, resource conflicts increase resulting in frequent feedback, and as Collision-Feedback reselects resources without limit when it receives feedback, it loses periodicity of used resources and fails to estimate which resources are being used and which are not.
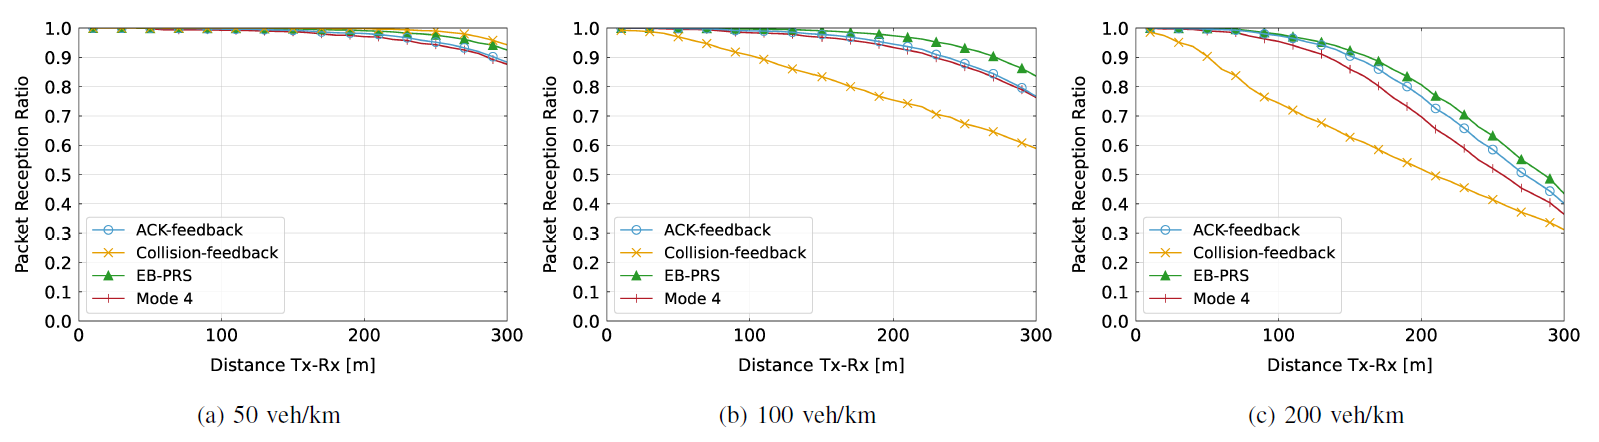
Fig. 7 plots the PRR with varying packet transmission intervals for EB-PRS and standard Mode 4 with a fixed traffic density of 200 veh/km in the highway scenario. As the transmission rate increased, the distance at which 90% PRR is achieved by Mode 4 is [131, 72, 40] m, whereas that of EB-PRS is [160, 82, 41] m, which is improved by [22.1, 13.9, 2.5]%, respectively. As the transmission period becomes shorter, the performance improvement decreases. This is because, the shorter the transmission period, the smaller the available resources, resulting in inevitably less chances for selecting a vacant resource.
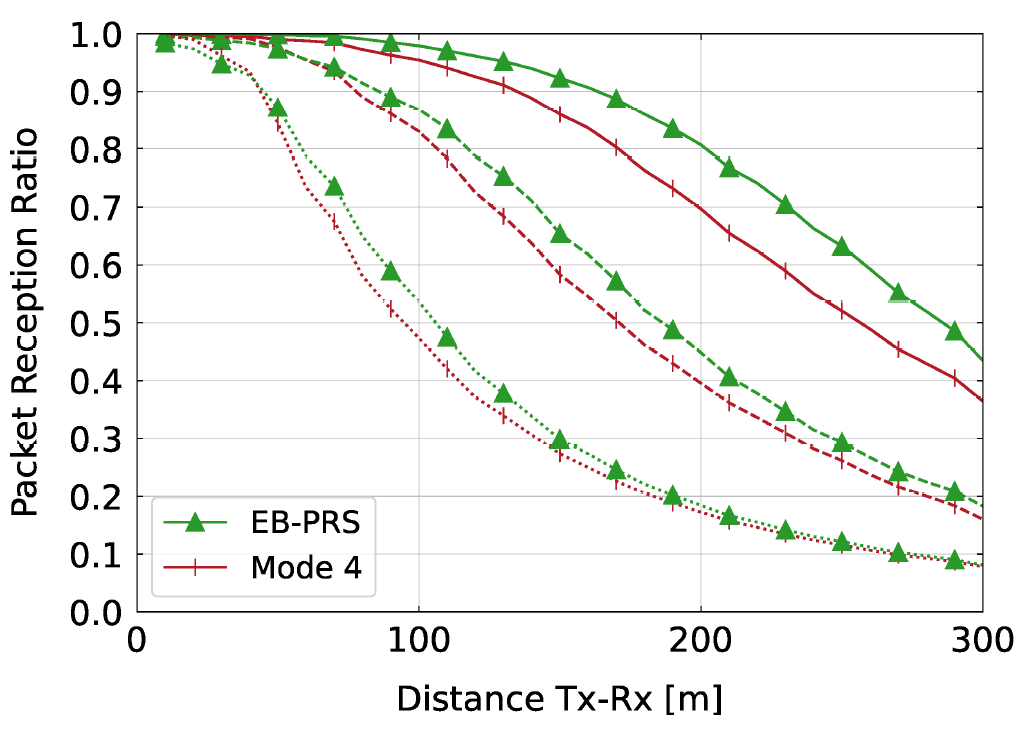
Fig. 8 plots the effective CAM range (distance at PRR ≥ 90%) in the urban scenario. Fig. 8(a) is with varying traffic densities when the transmission rate is 10 pps. The decrease in overall PRR as traffic density increases is consistent with the highway scenario, and EB-PRS again improves performance compared to other schemes. Fig. 8(b) is with varying transmission rate when the traffic density is fixed at 200 veh/km. Although not specified in the figure, EB- PRS performs at least 7.5% to 27.0% better than Mode 4 at different densities in urban scenarios (50, 100 veh/km), while in the 200 veh/km scenario, the performance of EB-PRS is almost similar to Mode 4. Still, ACK-Feedback and Collision- Feedback are definitely perform worse than Mode 4.
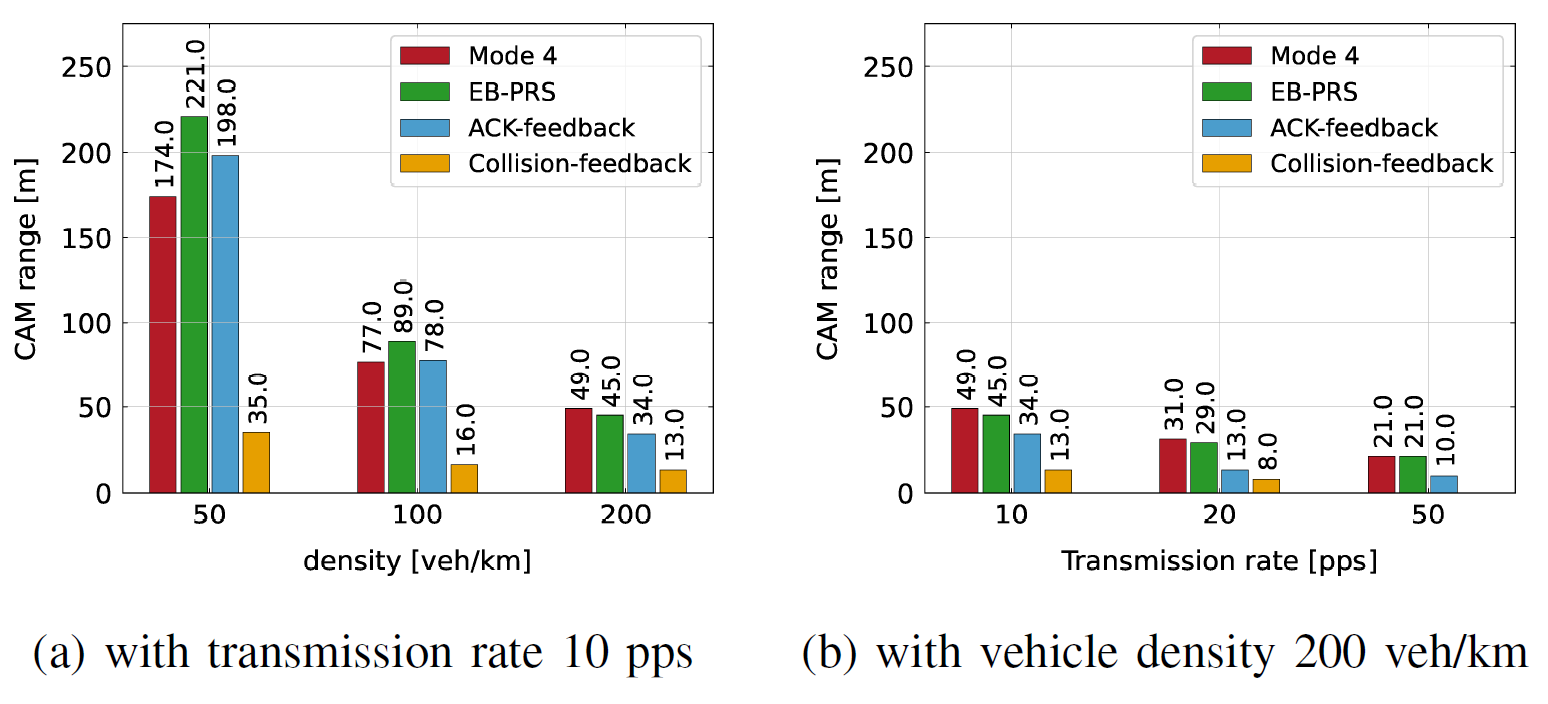
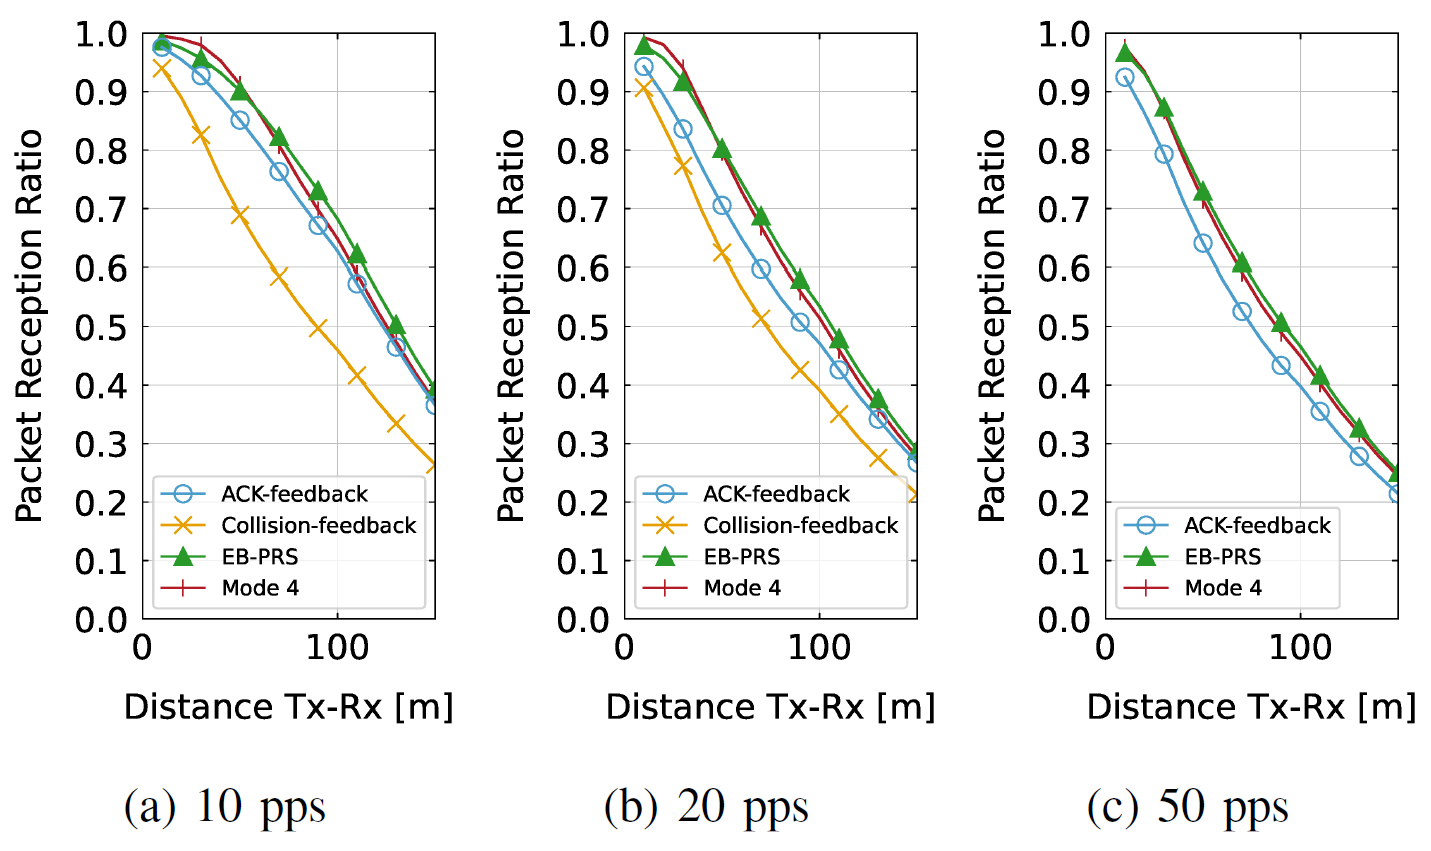
Fig. 9 plots the PRR comparing in the same scenario as Fig. 8(b). Fig. 9 shows the performance improvement of EB-PRS that was not seen in the CAM range. It can be seen that as the transmission rate increases, the performance improvement decreases compared to Mode 4 since the number of available resources decreases, showing a similar pattern to the highway scenario. Additionally, in the case of other feedback technologies, as the transmission rate becomes higher, performance degradation becomes more severe compared to Mode 4. Meanwhile, even in the PRR graph, Mode 4 and EB-PRS look almost identical at 50 pps and 200 veh/km in urban scenario, but you can see the hidden performance gain in throughput in Section V.C. That is, EB-PRS is superior to or similar to Mode 4 in all scenarios, an achievement that no other collision feedback-based algorithm has achieved, and is expected to be further improved through future work.
C. Throughput
In all scenarios except one, EB-PRS achieves better throughput than Mode 4 (the one is highway scenario with 20 pps and 200 veh/km, which we explain later), despite adding 30 bytes overhead to each packet for feedback. Fig. 10 plots the change in throughput when the transmission rate is fixed to 10 pps in highway and urban scenarios. Throughput increases as the traffic density increases because the number of surrounding vehicles capable of receiving packets increases. Urban scenario has higher throughput than the highway scenario because, as mentioned above, the urban scenario has a larger area density and thus the number of surrounding vehicles (that can receive messages) is larger.
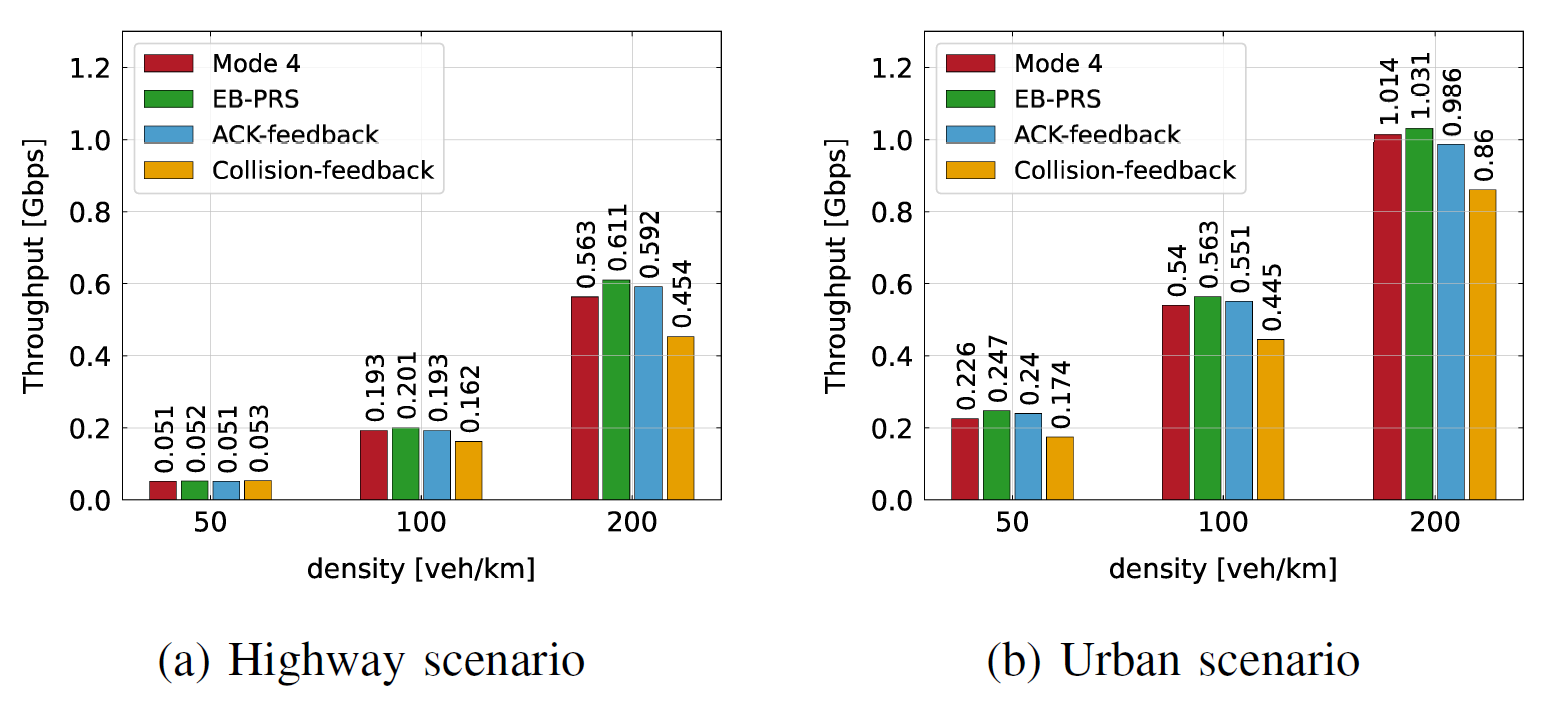
Fig. 11 plots the throughput with varying transmission rates when the traffic density is fixed at 200 veh/km in highway and urban scenarios. It can be noted as counter intuitive that the throughput does not increase with the transmission rate. This is because increased transmission rate also induces more collisions.
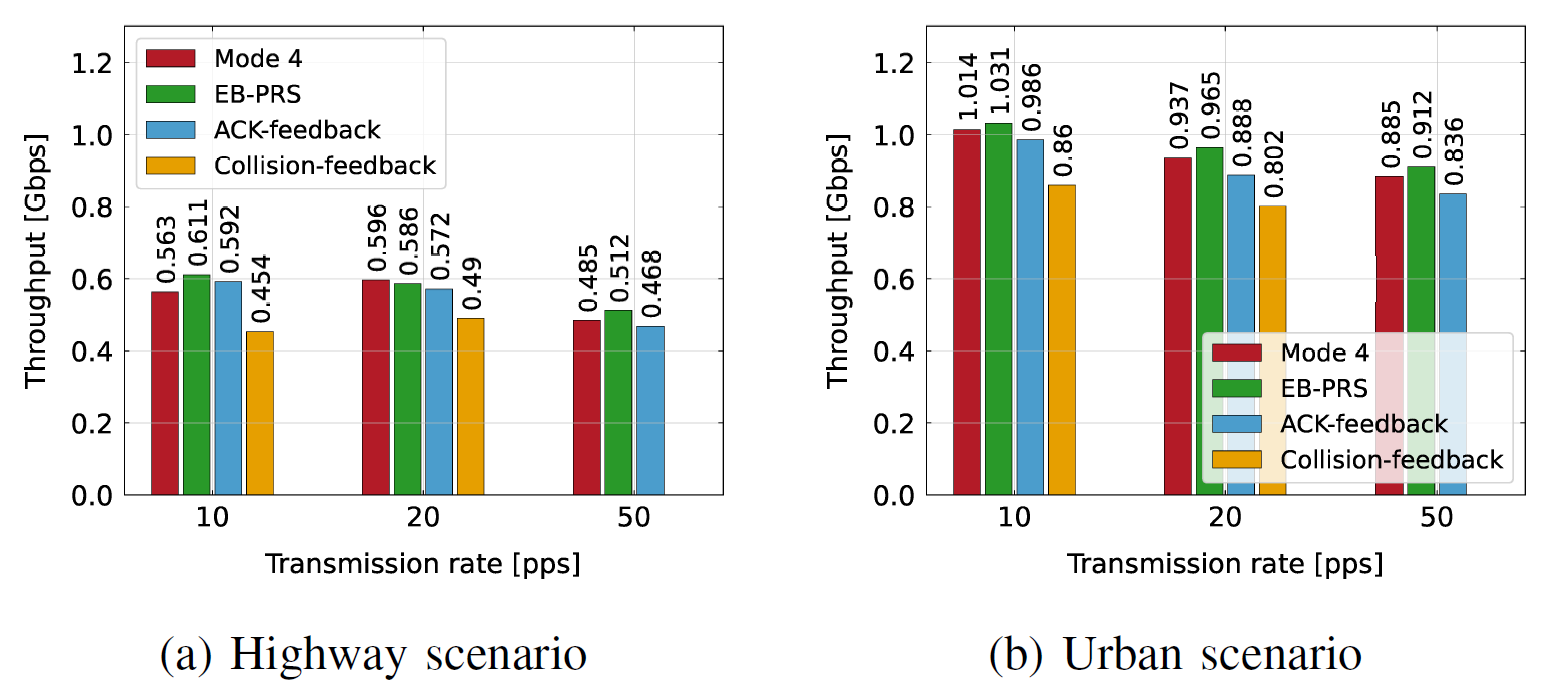
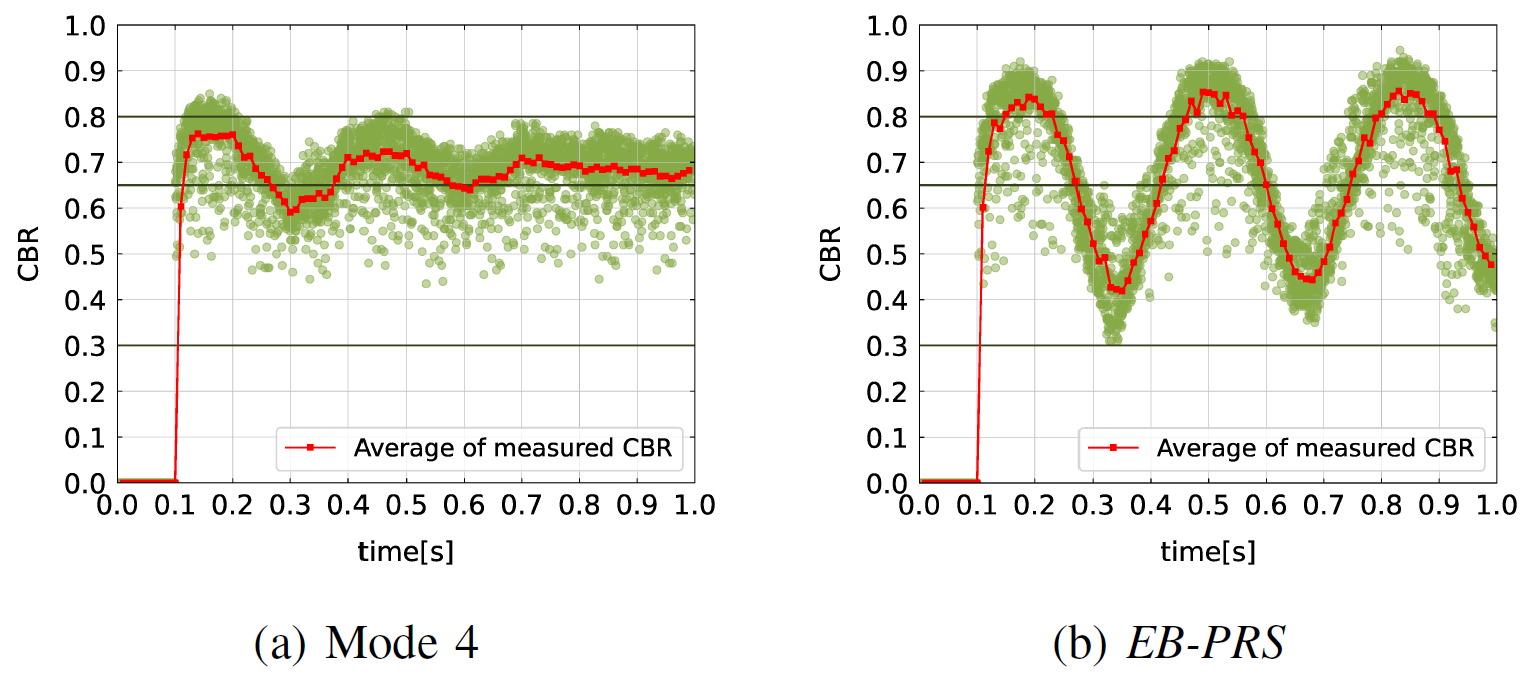
In highway scenario with 20 pps and 200 veh/km, EB-PRS has better PRR (Fig. 7) but less throughput (Fig. 11(a)) than Mode 4. This is due to the congestion control technique using channel occupancy ratio (CR) limit [35]. For CAM, when CBR exceeds 0.3, 0.65, and 0.8, the CR limit changes to 0.03, 0.006, and 0.003. In other words, the moment the CBR measurement value exceeds 0.8, the CR limit is greatly reduced and congestion control is performed by reducing packet transmission. The Fig. 12 is a scatter plot of the measured CBR values of each vehicle during the first 1 second of the simulation in Mode 4 and EB-PRS. Unlike Mode 4 in Fig. 12(a), EBPRS in Fig. 12(b) shows an oscillation [38]. In the first CBR measurement for each vehicle, with Mode 4 only 68 out of 400 vehicles measured above 0.8 while EB-PRS exceeded 0.8 in 243 vehicles. Therefore, the proportion of vehicles whose CR limit drops sharply to 0.003 increases, and the amount of message transmission is also significantly reduced compared to Mode 4. The CBR then decreases significantly, but this again increases the CR limit and increases the amount of messages sent, resulting in oscillations. EB-PRS has a higher percentage of vehicles with CBR exceeding 0.8, which means that the number of transmissions itself is relatively low compared to Mode 4, resulting in low throughput. The presence or absence of CBR oscillation in other scenarios is similar to EB-PRS and Mode 4. However, in the highway scenario with 20 pps and 200 veh/km, compared to the Mode 4 where the CBR value is close to 0.8, CBR of EB-PRS far exceeds 0.8 as transmission increased due to resource reselection, so only EBPRS was significantly affected by congestion control. To check the impact of congestion control, an experiment was conducted while maintaining the CR limit at 0.006 even if the CBR exceeded 0.8. As a result, the CAM ranges of Mode 4 and EBPRS were almost identical at [72, 82] m before and [73, 83] m after the congestion control change, but throughput shows a noticeable improvement for EB-PRS, from [0.596, 0.586] Gbps to [0.598, 0.631] Gbps. In other words, congestion control suitable for EB-PRS must be developed, and this is left as future work. Nevertheless, EB-PRS has the highest throughput in all most all setups, with up to 9.3 % and at least 1.7 % improvement compared to Mode 4. Also, this shows the hidden performance gain of EB-PRS mentioned in Section V.B.
D. Inter Packet Delay (IPD)
Fig. 13 plots the cumulative distribution function (CDF) of IPD according to the change in traffic density when the transmission rate is fixed to 10 pps in the highway scenario. In the case of EB-PRS and ACK-Feedback, there is a risk that IPD will increase more than the transmission period (ms) during the reselection process if resources need to be reselected based on the feedback after a packet transmission. However, this risk is offset by improvements in PRR. In Mode 4, since vehicles use the selected resource until the RC reaches 0, the IPD seems similar to the transmission period, but in a dense traffic environment, packet loss occurs frequently and the IPD becomes worse. As a result, EB-PRS, Mode 4, and ACK-Feedback show a similar pattern at higher traffic density.
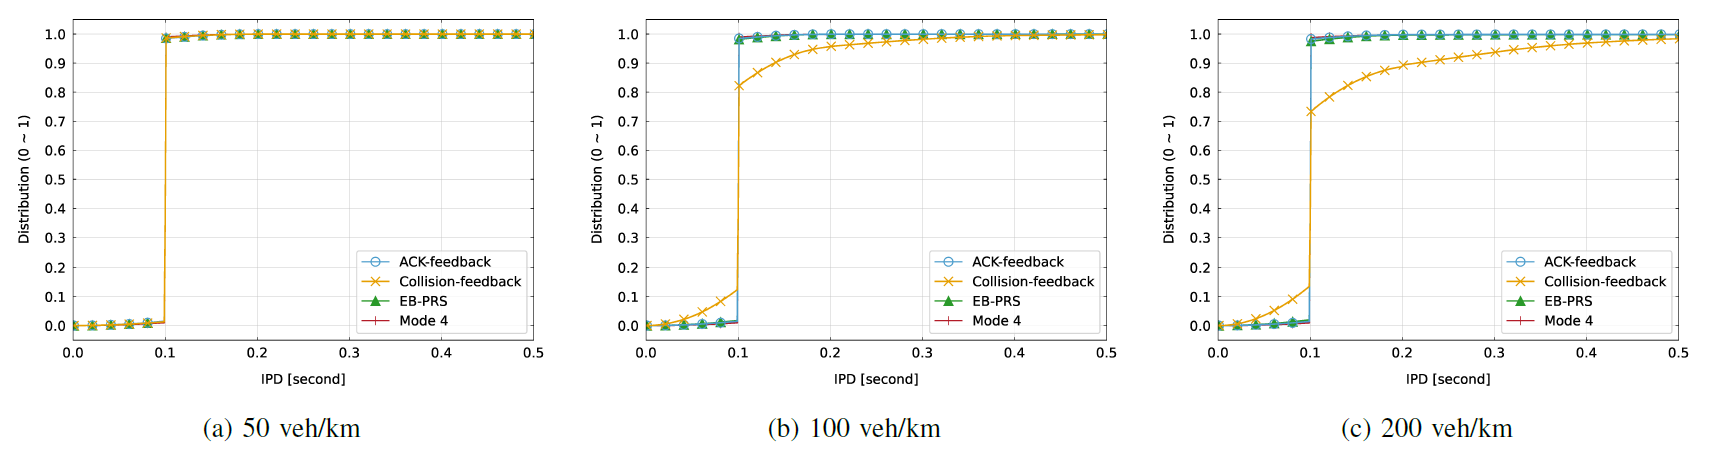
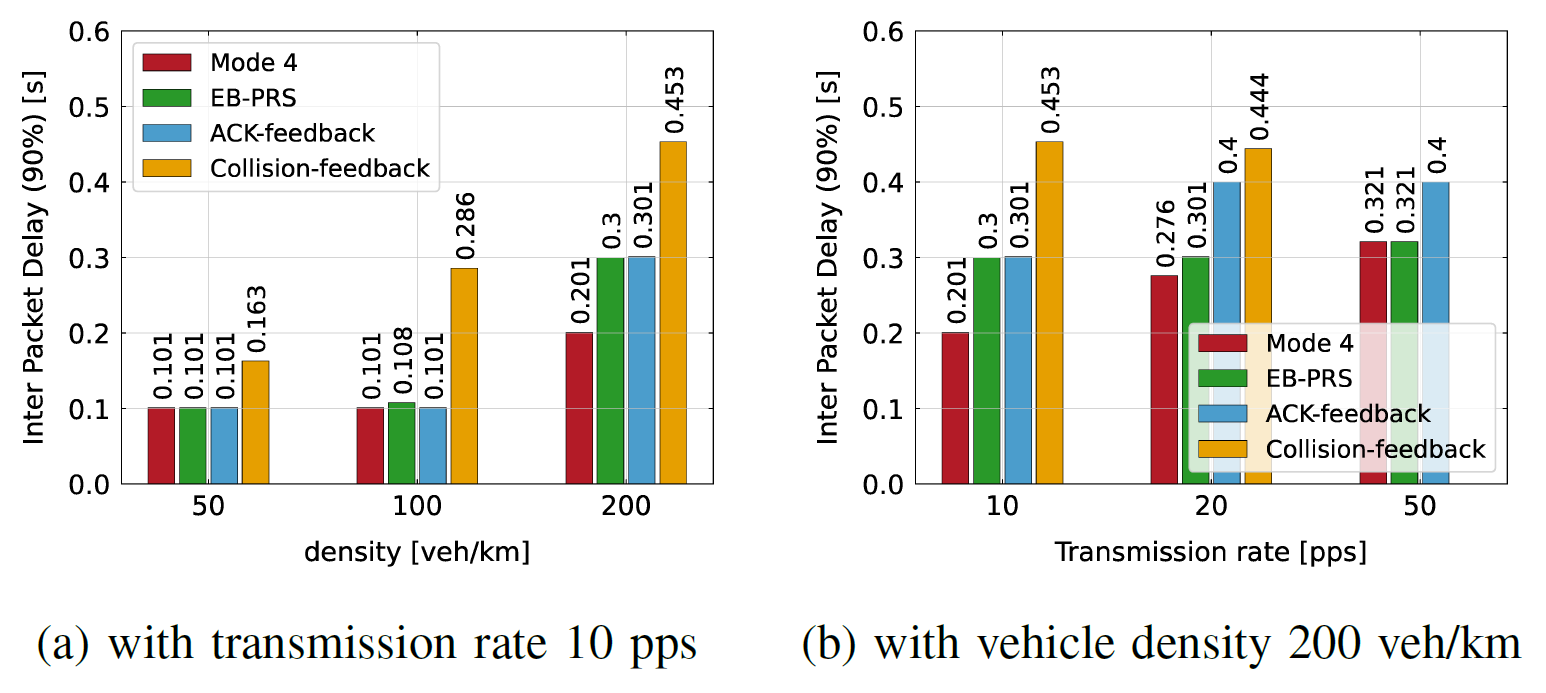
Fig. 14 plots the [TeX:] $${IPD}_{90 \%}$$ (90 percentile IPD) with varying transmission rate and traffic density in the highway scenario. Except for the case of 20 pps in Fig. 14(b), the [TeX:] $${IPD}_{90 \%}$$ of EB-PRS is lower than or equal to Mode 4. For the 20 pps case, the [TeX:] $${IPD}_{90 \%}$$ difference between EB-PRS and [TeX:] $${IPD}_{90 \%}$$ is 50 ms, and this is caused by the reduction in transmission due to congestion control as mentioned in Section V.C. Given that the 90th percentile IPD is specified to be less than 650 ms according to the NHTSA guidelines [39], this is an acceptable latency considering the gain in PRR and effective CAM range improvements.
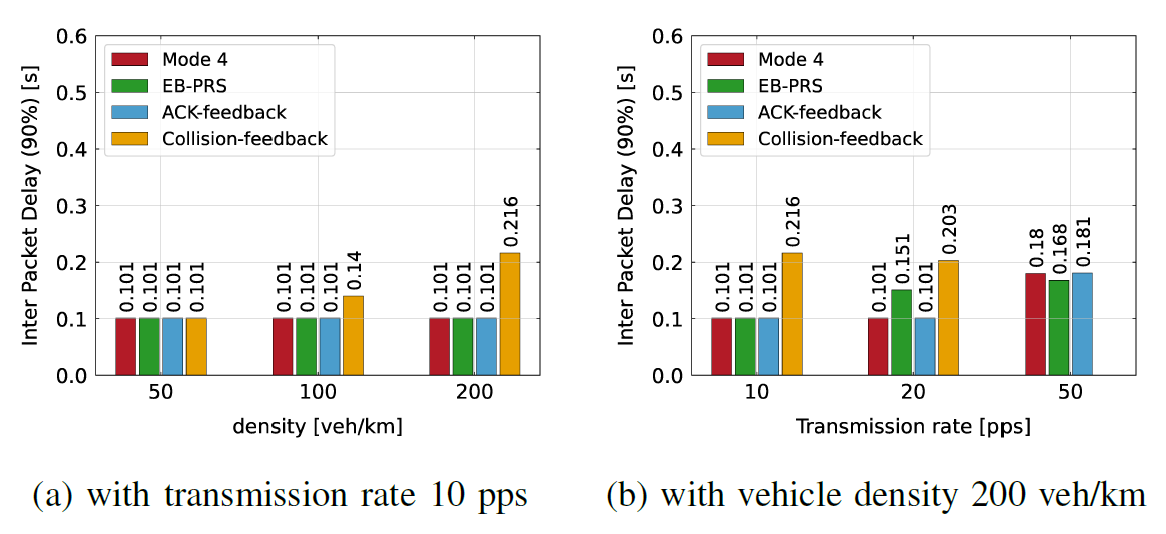
Fig. 15 plots the [TeX:] $${IPD}_{90 \%}$$ in the urban scenario. EB-PRS has [TeX:] $${IPD}_{90 \%}$$ slightly higher or equal to Mode 4. Nevertheless, the biggest IPD difference between EB-PRS and Mode 4 for the urban scenario is 99 ms in 200 veh/km case in Fig. 15(a), which is much lower than NHTSA’s proposed 650 ms and lower than the 100 ms transmission period. Furthermore, in all scenarios, Collision-Feedback worsens its [TeX:] $${IPD}_{90 \%}$$ as traffic density increases or transmission rate increases. This is because the process of avoiding resources secured by other vehicles using periodicity is not possible due to frequent resource reselection. On the other hand, EB-PRS establishes a reselection probability function (3) to prevent the reselection process from occurring frequently, improving PRR without over-deteriorating IPD.
E. Bloom Filter Parameter Selection
False positive rate of the bloom filter depends on the length (L) and the number of hash functions (K). In general, larger L will generate less false positives which results in more accurate delivery rate estimation at the cost of higher feedback overhead. Larger K will provide lower false positives given sufficiently large L, but may increase false positives due to higher overlap if L is small. In order to find an appropriate values of L and K for EB-PRS, simulations using MATLAB is performed.
In each iteration, we generate 115 random MAC addresses as potential neighboring vehicles. We select 115 because, in the urban scenario of Section V.A, the maximum number of neighboring vehicles is 115 when the traffic density is 200 veh/km. Then the false positives are counted while adding the MAC addresses to the bloom filter one by one. The false positives are calculated by dividing the number of hits by the total number of vehicles, and this was repeated 100 times to obtain an average value. For the hash functions, each function is numbered as kth from 1 to K, and set as a hash that divides the MAC address by the kth prime and finds the remainder after dividing the quotient by L.
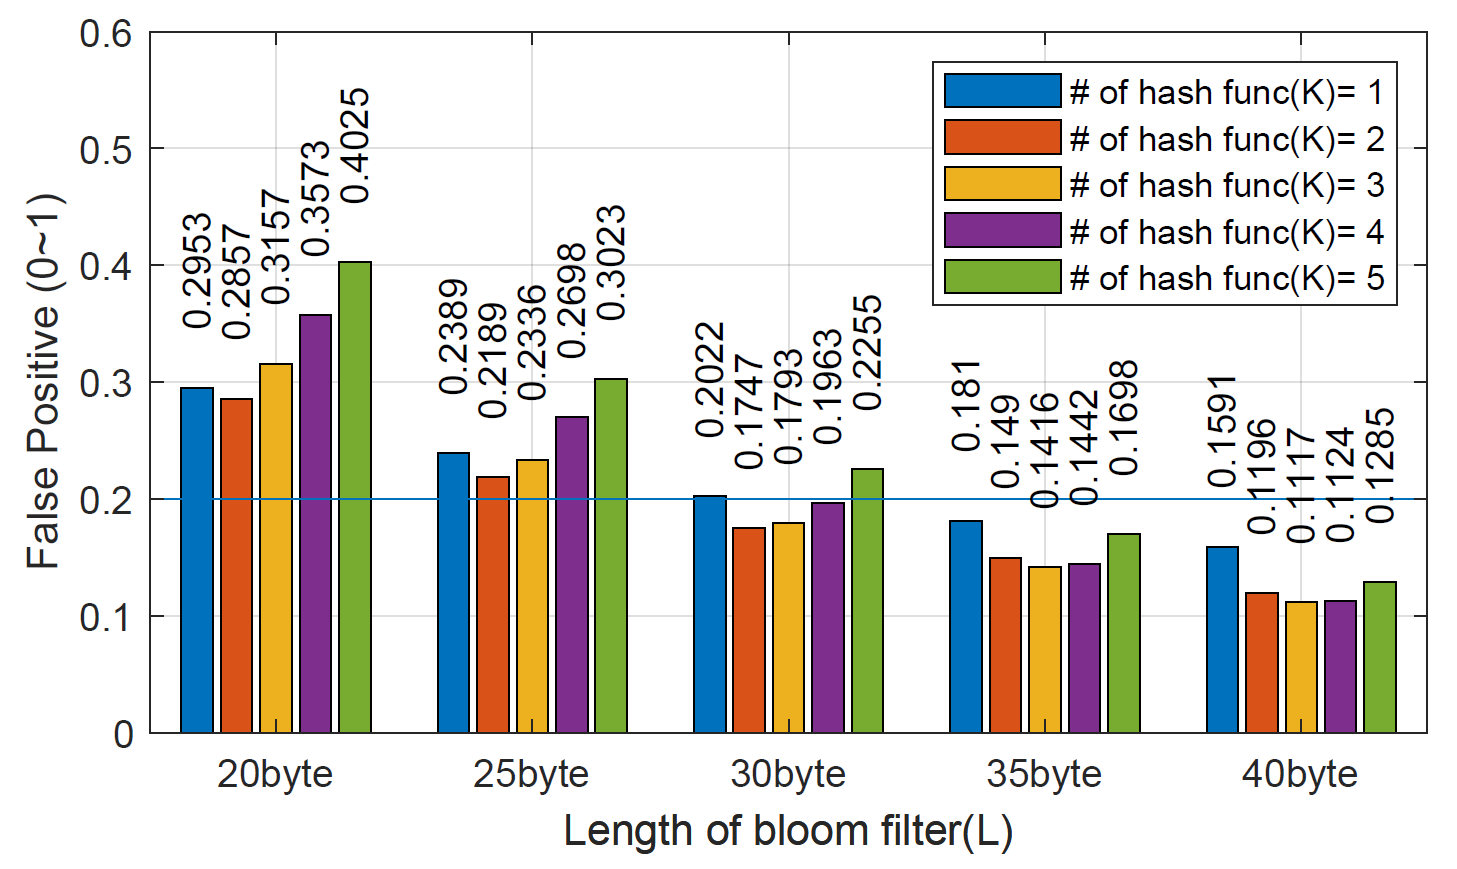
Fig. 16 plots the simulated average false positive rates while varying the bloom filter length (L) from 20 bytes to 40 bytes and the number of hash functions (K) from one to five. As L increases, the probability of false positives decreases in general at the cost of increase in the overhead required for feedback. Impact of K is a bit more complex; higher K produces more uniqueness to bit patterns on each MAC address, but exhausts the available L space quicker which will eventually increase overlaps and thus false positives. On the other hand, lower K has the opposite behavior where insufficient uniqueness obfuscates address identification. Therefore, an appropriate K should be chosen to balance both the false positive rate as well as feedback overhead. Based on these observations, we chose L = 30 bytes and K = 2 to minimize feedback overhead while satisfying false positive rate of below 20%.
VI. CONCLUSION
In this work, we proposed a delivery rate estimation based probabilistic resource scheduling algorithm (EB-PRS). It addresses the problem of SB-SPS algorithm in C-V2X Mode 4 where collisions due to resource conflicts cannot be detected and are prolonged due to algorithm behavior, especially with increased vehicle density or mobility, resulting in poor performance. The delivery ratio is estimated via opportunistic bloom filter-based feedback, and EB-PRS carefully reselects resources probabilistically based on the estimated delivery ratio to maximize performance. Evaluation on highway and urban scenarios show that EB-PRS improves PRR and throughput while [TeX:] $${IPD}_{90 \%}$$ is similar to or lower than standard Mode 4. As our future work, we plan to investigate the upcoming 5G NR-V2X [5], [6], [40] and develop a machine learning technique that can maximize performance for better cooperative recognition, taking into account changing and varying packet transmission rate, traffic density and message types.
Biography
Doyeon Hyeon

Doyeon Hyeon received the B.S. degree from the School of Integrative Engineering, Chung-Ang University, Seoul, Republic of Korea, in 2020. She is currently continuing her study towards M.S. degree in the Department of Computer Science and Engineering at Chung-Ang University. She is also a Research Assistant at the Networked Systems
Biography
Biography
Chaeyeong Lee

Chaeyeong Lee received the B.S. degree from the School of Computer Software, Busan University of Foreign Stuides, Busan, Republic of Korea, in 2022. She is currently continuing her study towards M.S. degree in the Department of Computer Science and Engineering at Chung-Ang University. She is also a Research Assistant at the Networked Systems
Biography
Biography
Biography
Biography
Sungrae Cho
Sungrae Cho is a Professor with the School of Computer Sciences and Engineering, Chung-Ang University (CAU), Seoul. Prior to joining CAU, he was an Assistant Professor with the Department of Computer Sciences, Georgia Southern University, Statesboro, GA, USA, from 2003 to 2006, and a Senior Member of Technical Staff with the Samsung Advanced Institute of Technology (SAIT), Kiheung, South Korea, in 2003. From 1994 to 1996, he was a Research Staff Member with Electronics and Telecommunications Research Institute (ETRI), Daejeon, South Korea. From 2012 to 2013, he held a Visiting Professorship with the National Institute of Standards and Technology (NIST), Gaithersburg, MD, USA. He received the B.S. and M.S. degrees in Electronics Engineering from Korea University, Seoul, South Korea, in 1992 and 1994, respectively, and the Ph.D. degree in Electrical and Computer Engineering from the Georgia Institute of Technology, Atlanta, GA, USA, in 2002. He has been a KICS Fellow since 2021. He received numerous awards including Haedong Best Researcher of 2022 in Telecommunications and Award of Korean Ministry of Science and ICT in 2021. His current research interests include wireless networking, network intelligence, and network optimization. He has been a Subject Editor of IET Electronics Letter since 2018, an Editor of ICT Express (Elsevier) since 2022, and was an Area Editor of Ad Hoc Networks Journal (Elsevier) from 2012 to 2017. He has served numerous international conferences as a General Chair, TPC Chair, or an Organizing Committee Chair, such as IEEE ICC, IEEE SECON, ICOIN, ICTC, ICUFN, TridentCom, and the IEEE MASS, and as a Program Committee Member, such as IEEE ICC, GLOBECOM, VTC, MobiApps, SENSORNETS, and WINSYS.
Biography
Jeongyeup Paek
Jeongyeup Paek is a Professor at Chung-Ang University, Department of Computer Science and Engineering, Seoul, Republic of Korea since 2015. He received his B.S. degree from Seoul National University in 2003 and his M.S. degree from University of Southern California in 2005, both in Electrical Engineering. He then received his Ph.D. degree in Computer Science from the University of Southern California in 2010. He worked at Deutsche Telekom R&D Labs USA as a Research Intern in 2010, and then joined Cisco Systems in 2011 where he was a Technical Leader in the Internet of Things Group. In 2014, he was with the Hongik University, Department of Computer Information Communication as an Assistant Professor. He is an IEEE Senior Member and an ACM Member.
References
- 1 I. Soto, M. Calderon, O. Amador, and M. Urueña, "A survey on road safety and traffic efficiency vehicular applications based on C-V2X technologies," Veh. Commun., vol. 33, p. 100428, 2022.doi:[[[10.1016/j.vehcom.2021.100428]]]
- 2 M. Christopoulou, S. Barmpounakis, H. Koumaras, and A. Kaloxylos, "Artificial intelligence and machine learning as key enablers for V2X communications: A comprehensive survey," Veh. Commun., vol. 39, p. 100569, 2023.doi:[[[10.1016/j.vehcom.2022.100569]]]
- 3 B. Kang, J. Yang, J. Paek, and S. Bahk, "ATOMIC: Adaptive transmission power and message interval control for C-V2X Mode 4," IEEE Access, vol. 9, pp. 12309-12321, 2021.doi:[[[10.1109/ACCESS.2021.3051760]]]
- 4 P. Subedi, B. Yang, and X. Hong, "Synchronizing tasks for distributed learning in connected and autonomous vehicles," J. Commun. Netw., vol. 24, no. 4, pp. 393-407, 2022.doi:[[[10.23919/JCN.2022.000028]]]
- 5 L. Lusvarghi, A. Molina-Galan, B. Coll-Perales, J. Gozalvez, and M. L. Merani, "A comparative analysis of the semi-persistent and dynamic scheduling schemes in NR-V2X mode 2," Veh. Commun., vol. 42, p. 100628, 2023.doi:[[[10.1016/j.vehcom.2023.100628]]]
- 6 S. Jung, H. Kim, X. Zhang, and S. Dey, "GaMiCO: Game-slicing based multi-interface computation offloading in 5G vehicular networks," vol. 25, no. 4, pp. 491-506, 2023.doi:[[[10.23919/JCN.2023.000027]]]
- 7 S. Park, B. Kim, H. Yoon, and S. Choi, "RA-eV2V: Relaying systems for LTE-V2V communications," vol. 20, no. 4, pp. 396-405, 2018.doi:[[[10.1109/JCN.2018.000055]]]
- 8 J. Heo, B. Kang, J. M. Yang, J. Paek, and S. Bahk, "Performance-cost tradeoff of using mobile roadside units for V2X communication," IEEE Trans. Veh. Technol., vol. 68, no. 9, pp. 9049-9059, 2019.doi:[[[10.1109/TVT.2019.2925849]]]
- 9 Evolved universal terrestrial radio access (E-UTRA) and evolved universal terrestrial radio access network (E-UTRAN); overall description; stage 2, document TS 36.300 V14.1.0, Dec. 2016.custom:[[[-]]]
- 10 Proximity-based services (ProSe); stage 2, document TS 23.303 V14.1.0, Dec. 2016.custom:[[[-]]]
- 11 D. Yuan, D. Hu, and X. Chen, "Resource allocation in C-V2X Mode 3 based on the exchanged preference profiles," Electronics, vol. 12, no. 5, p. 1071, 2023. (Online). Available: http://dx.doi.org/10.3390/ electronics12051071doi:[[[10.3390/electronics1071]]]
- 12 S. Sabeeh, K. Wesołowski, and P. Sroka, "C-V2X centralized resource allocation with spectrum re-partitioning in highway scenario," Electronics, vol. 11, no. 2, p. 279, 2022. (Online). Available: http://dx.doi.org/ 10.3390/electronics11020279doi:[[[10.3390/electronics1109]]]
- 13 Evolved universal terrestrial radio access (E-UTRA); user equipment (UE) radio transmission and reception, document TS 36.101 V14.10.0, Jan. 2019.custom:[[[-]]]
- 14 Evolved universal terrestrial radio access (E-UTRA); physical layer procedures, document TS 36.213 V14.9.0, Dec. 2018.custom:[[[-]]]
- 15 Intelligent transport systems (ITS); vehicular communications; basic set of applications; part 2: specification of cooperative awareness basic service, document EN 302 637-2 V1.3.2, Nov. 2014.custom:[[[-]]]
- 16 S. Bartoletti, B. M. Masini, V . Martinez, I. Sarris, and A. Bazzi, "Impact of the generation interval on the performance of sidelink CV2X autonomous mode," IEEE Access, vol. 9, pp. 35121-35135, 2021.doi:[[[10.1109/ACCESS.2021.3061913]]]
- 17 Evolved universal terrestrial radio access (E-UTRA); medium access control (MAC) protocol specification , document TS 36.321 V14.4.0, Sep. 2017.custom:[[[-]]]
- 18 Y . Jeon, S. Kuk, and H. Kim, "Reducing message collisions in sensingbased semi-persistent scheduling (SPS) by using reselection lookaheads in cellular V2X," Sensors, vol. 18, no. 12, 2018.doi:[[[10.3390/s18124388]]]
- 19 Y . Jeon and H. Kim, "An explicit reservation-augmented resource allocation scheme for C-V2X sidelink Mode 4," IEEE Access, vol. 8, pp. 147241-147255, 2020.doi:[[[10.1109/ACCESS.2020.3015549]]]
- 20 X. He, J. Lv, J. Zhao, X. Hou, and T. Luo, "Design and analysis of a short-term sensing-based resource selection scheme for C-V2X networks," IEEE Internet Things J., vol. 7, no. 11, pp. 11209-11222, 2020.doi:[[[10.1109/JIOT.2020.2996958]]]
- 21 S. Sabeeh, P. Sroka, and K. Wesołowski, "Estimation and reservation for autonomous resource selection in C-V2X Mode 4," in Proc. IEEE PIMRC, 2019.doi:[[[10.1109/PIMRC.2019.8904095]]]
- 22 S. Sabeeh and K. Wesołowski, "C-V2X Mode 4 resource allocation in high mobility vehicle communication," in Proc. IEEE PIMRC, 2020.doi:[[[10.1109/PIMRC48278.2020.9217297]]]
- 23 R. Molina-Masegosa, M. Sepulcre, and J. Gozalvez, "Geo-based scheduling for C-V2X networks," IEEE Trans. Veh. Technol., vol. 68, no. 9, pp. 8397-8407, 2019.doi:[[[10.1109/TVT.2019.2924698]]]
- 24 J. He, Z. Tang, Z. Fan, and J. Zhang, "Enhanced collision avoidance for distributed LTE vehicle to vehicle broadcast communications," IEEE Commun. Lett., vol. 22, no. 3, pp. 630-633, 2018.doi:[[[10.1109/LCOMM.2018.2791399]]]
- 25 Y . Yoon and H. Kim, "Balancing power and rate control for improved congestion control in cellular V2X communication environments," IEEE Access, vol. 8, pp. 105071-105081, 2020.doi:[[[10.1109/ACCESS.2020.2999925]]]
- 26 SAE International, "On-board system requirements for V2V safety communications," S. J2945/1, 2016.custom:[[[-]]]
- 27 A. Dayal et al., "Adaptive semi-persistent scheduling for enhanced onroad safety in decentralized V2X networks," in Proc. IFIP Networking Conference, 2021.doi:[[[10.48550/arXiv.2104.01804]]]
- 28 B. Kang, S. Jung, and S. Bahk, "Sensing-based power adaptation for cellular V2X Mode 4," in Proc. IEEE DySPAN, 2018.doi:[[[10.1109/DySPAN.2018.8610405]]]
- 29 P. Wendland and G. Schaefer, "Feedback-based hidden-terminal mitigation for distributed scheduling in cellular V2X," in Proc. IFIP Networking Conference, 2020.custom:[[[-]]]
- 30 Y . Yoon and H. Kim, "Resolving persistent packet collisions through broadcast feedback in cellular V2X communication," Future Internet, vol. 13, no. 8, p. 211, 2021.doi:[[[10.3390/fi13080211]]]
- 31 User equipment (UE) to V2X control function; protocol aspects; stage 3, document TS 24.386 V14.5.0, Jun. 2020.custom:[[[-]]]
- 32 Study on LTE-based V2X services, document TR 36.885 V14.0.0, Jun. 2016.custom:[[[-]]]
- 33 A. Pagh, R. Pagh, and S. S. Rao, "An optimal bloom filter replacement," in Proc. SODA, 2005.custom:[[[https://www.itu.dk/people/pagh/papers/bloom.pdf]]]
- 34 Intelligent transport systems (ITS); radiocommunications equipment operating in the 5 855 MHz to 5 925 MHz frequency band; Harmonised Standard covering the essential requirements of article 3.2 of directive 2014/53/EU, document EN 302 571 V2.1.1, Feb. 2017.custom:[[[-]]]
- 35 Intelligent transport systems (ITS); congestion control mechanisms for the C-V2X PC5 interface; access layer part, document TS 103 574 V1.1.1, Nov. 2018.custom:[[[-]]]
- 36 V . Todisco et al., "Performance analysis of sidelink 5G-V2X mode 2 through an open-source simulator," IEEE Access, vol. 9, pp. 145648-145661, 2021.doi:[[[10.1109/ACCESS.2021.3121151]]]
- 37 P. A. Lopez et al., "Microscopic traffic simulation using SUMO," in Proc. IEEE ITSC, 2018. (Online). Available: https://elib.dlr.de/124092/custom:[[[https://elib.dlr.de/124092/]]]
- 38 Y . Park and H. Kim, "Preventing congestion control oscillation in cellular vehicular communication," Electron. Lett., vol. 57, no. 24, pp. 927-929, 2021.doi:[[[10.1049/ell2.12319]]]
- 39 A. Rostami, H. Krishnan, and M. Gruteser, "V2V safety communication scalability based on the SAE J2945/1 standard," in Proc. ITS America, 2018.custom:[[[https://winlab.rutgers.edu/~rostami/files/pdf/rostami2018v2v.pdf]]]
- 40 I. Rasheed, "Dynamic mode selection and resource allocation approach for 5G-vehicle-to-everything (V2X) communication using asynchronous federated deep reinforcement learning method," Veh. Commun., vol. 38, p. 100532, 2022.doi:[[[10.1016/j.vehcom.2022.100532]]]